


Stock and Commodities Trading for SP500, Gold, Silver and Crude Oil
Stock-Markets / Financial Markets 2010 Jan 28, 2010 - 12:45 AM GMTBy: Chris_Vermeulen

 The stock indexes have been trading very choppy making it difficult for swing/trend traders. It’s during times like this when seasoned traders rise above the herd of average traders.
If you only trade one strategy like swing trading or trend trading then you are likely finding it difficult to make money right now. On the other hand, day traders are having a blast right now as they take advantage of the powerful intraday rallies and sell offs.
I personally like swing trading but during times like this, when I know it will not work, I have to switch my strategy to day trading and focus on the 60 minute and 5 minute charts.
SP500 Index Fund – Intraday Setup
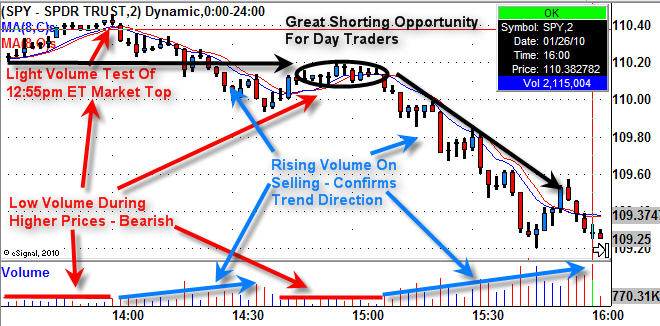
I posted this chart earlier this week and I want to be sure everyone takes something away from this chart as I believe it shows a perfect low risk setup for shorting the market, or you could buy a reverse fund which goes up as the market moves down.
At first glance this chart is noisy, but if you simply focus on the all the different color analysis separately you will notice how simple trading can be and what you should be looking for.
Red Analysis:
1. Overall market trend is down so we are looking for a short trade, signs of weakness.
2. First we see a light volume test of the previous high set earlier in the day. The low volume indicates there are not many participants in the move up and that is a weak sign.
3. Between 14:30- 15:30 we notice the price start to drift higher on very light volume. Also, the price moved up into a resistance level. This to me is a perfect setup.
4. You would sell short or buy a reverse index fund at this point hoping for the market to start selling. You could also wait until it started to drop before taking a position but when a chart looks this good I try to get in at the highest price possible.
Blue Analysis:
1. The price starts to drop forming several small bear flags going into 14:30 before bouncing. Also note the volume began to rise as more selling was happening. This tells us that trading activity is predominately selling and that we should also focus on shorting when the time is right.
2. Again, the price starts to drop forming several small bear flags going from 15:00 – 15:45 before bouncing. Also note the volume began to rise as more sellers took part in this short term trend.
Black Analysis:
1. This shows more or less the resistance level, area to short the index and the nice trend down.
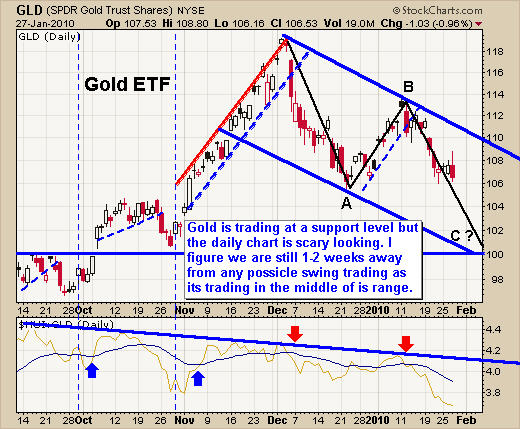
Gold GLD ETF Trading
Gold has been under selling pressure since early December. That powerful drop and the chart pattern it has formed will generally resolves itself after an ABC retrace pattern. I have drawn this on the chart which is what I think will happen in the near term. This daily chart of GLD ETF has a small 4 day bear flag and bearish reversal candle which is pointing to lower prices in the near term.
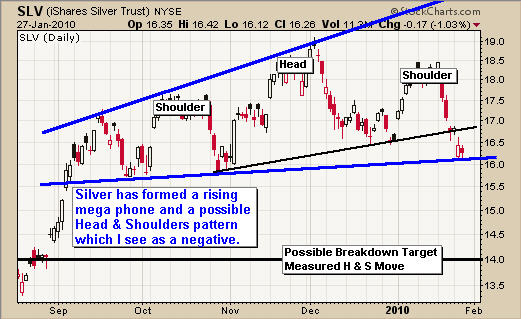
Silver SLV ETF Trading
Silver has a funky looking chart. It has formed a large megaphone pattern and possible head & shoulders pattern. Both are bearish and if we use the Head & Shoulders to calculate where silver could end up trading if it continues to break down, then $14.00 would be a level to look for a bounce.
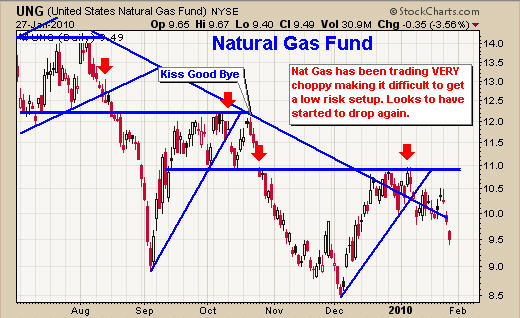
Natural Gas UNG Fund
The natural gas fund UNG has been in a down trend for over a year and the recent drop looks to be the start of another sell off. This could possibly form a reverse head & shoulders pattern with this drop moving UNG down to the $8.75 – $9.00 area. We will have to wait and watch things unfold for now.
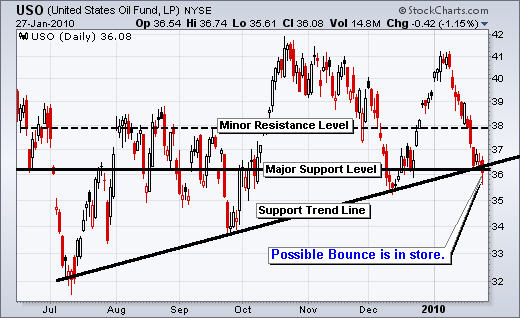
Crude Oil USO Fund
USO looks to be trading at support. I am inclined to patiently wait another session before possibly taking a position.
Mid-Week Trading Conclusion:
In short, I feel the overall market could bounce including stocks and possibly commodities, but the selling is not over yet in my opinion. The drop we have seen in the past week is the half way mark. So this bounce would be the starting of an ABC retrace for stock indexes. During choppy times I like to be sitting in cash and or day trading for short term profits.
Precious metals do look oversold and ready for a small bounce or sideways move; I do think they will head lower. Too many traders are still holding on to their gold positions and until a large number of them get scared out of their positions, we will not see gold rocket higher.
Natural gas looks like it’s about to head much lower this week while oil looks ready for a solid bounce off support.
We continue to wait for new low risk setups as different investment scenarios unfold.
Get my Free Weekly ETF Trading Reports at www.GoldAndOilGuy.com
Hello, I'm Chris Vermeulen founder of TheGoldAndOilGuy and NOW is YOUR Opportunity to start trading GOLD, SILVER & OIL for BIG PROFITS. Let me help you get started.
To Your Financial Success,
By Chris Vermeulen
Chris@TheGoldAndOilGuy.com
Please visit my website for more information. http://www.TheGoldAndOilGuy.com
Chris Vermeulen is Founder of the popular trading site TheGoldAndOilGuy.com. There he shares his highly successful, low-risk trading method. For 6 years Chris has been a leader in teaching others to skillfully trade in gold, oil, and silver in both bull and bear markets. Subscribers to his service depend on Chris' uniquely consistent investment opportunities that carry exceptionally low risk and high return.
This article is intended solely for information purposes. The opinions are those of the author only. Please conduct further research and consult your financial advisor before making any investment/trading decision. No responsibility can be accepted for losses that may result as a consequence of trading on the basis of this analysis.
Chris Vermeulen Archive |
© 2005-2022 http://www.MarketOracle.co.uk - The Market Oracle is a FREE Daily Financial Markets Analysis & Forecasting online publication.