


A Decade of Hot Commodities
Commodities / Commodities Trading Jan 19, 2010 - 06:59 AM GMTBy: Frank_Holmes

 We’ve updated our popular Periodic Table of Commodity Returns, and the headline news should come as no surprise – 2009 was a complete turnaround for the sector’s 2008 performance.
Commodities (as measured by the Reuters-Jefferies CRB Index) rose 24 percent in 2009, the largest single-year increase since the early 1970s.
In 2008, only one of the 14 commodities in the table finished positive – gold, up a scant 5.8 percent – while five finished with losses exceeding 50 percent, led by lead at a negative 63.5 percent.
Last year, only three of the 14 ended up underwater for the year, with coal coming in at rock bottom at minus 13 percent. Four of the industrial metals – copper, lead, zinc and palladium – each rose more than 100 percent in 2009.
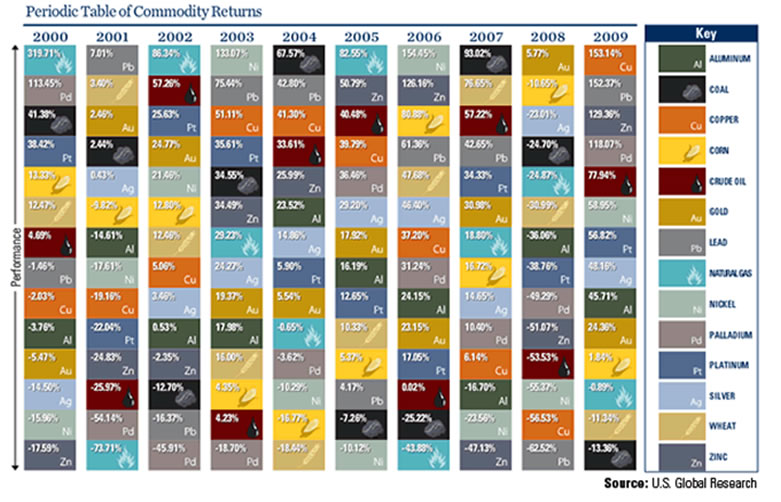
Just to get into the top half of 2009’s performers, a commodity needed gains of about 57 percent, as you can see with platinum in the 10-year chart above. In fact, while gold received tonnes of attention last year, its 24 percent returns were only good enough for 10th place.
There are many ways to analyze the data in the periodic table – I’ll share just a few basic observations.
- Of the 140 squares in the table (14 commodities times 10 years), 92 of them contain positive returns – that’s just under two-thirds success covering a range from the spectacular 320 percent up year for natural gas in 2000 down to the microscopic 0.02 percent gain by crude oil in 2006.
- Gold had the most positive years – its streak now stands at nine straight years after a 5.5 percent loss in 2000, when the bullion price dipped below $265, roughly a quarter of the current price. Oil, platinum and silver all had eight positive years during the decade, while nickel had six down years.
- Natural gas had the most extreme swings, finishing at #1 three times and at the bottom twice. One year after recording the biggest yearly gain in 2000, natural gas had the worst single-year loss – minus 74 percent.
- Aluminum and silver had the least relative volatility and the most years hovering around the middle. Even in their best performance year (2009), both were in the bottom half – silver at #8 and aluminum at #9.
We believe that the secular bull market for commodities and natural resources stocks that began in 2000 is far from over. The International Monetary Fund believes that commodity prices will rise further in 2010 as a result of global economic recovery and escalating demand from fast-growing emerging markets.
The expanding middle class in China, Brazil and the other biggest emerging economies want more of the material goods taken for granted in the developed world. They are laying claim to a bigger share of the world’s commodities, many of which could face future supply constraints.
History shows that commodity supercycles typically last 20 to 25 years, though not without periods of volatility. If the current cycle follows the historic pattern, we could be just starting the second half of a prolonged upward trend.
[View the Complete Interactive Table]
By Frank Holmes, CEO , U.S. Global Investors
Frank Holmes is CEO and chief investment officer at U.S. Global Investors , a Texas-based investment adviser that specializes in natural resources, emerging markets and global infrastructure. The company's 13 mutual funds include the Global Resources Fund (PSPFX) , Gold and Precious Metals Fund (USERX) and Global MegaTrends Fund (MEGAX) .
More timely commentary from Frank Holmes is available in his investment blog, “Frank Talk”: www.usfunds.com/franktalk .
Please consider carefully the fund's investment objectives, risks, charges and expenses. For this and other important information, obtain a fund prospectus by visiting www.usfunds.com or by calling 1-800-US-FUNDS (1-800-873-8637). Read it carefully before investing. Distributed by U.S. Global Brokerage, Inc.
All opinions expressed and data provided are subject to change without notice. Some of these opinions may not be appropriate to every investor. Gold funds may be susceptible to adverse economic, political or regulatory developments due to concentrating in a single theme. The price of gold is subject to substantial price fluctuations over short periods of time and may be affected by unpredicted international monetary and political policies. We suggest investing no more than 5% to 10% of your portfolio in gold or gold stocks. The following securities mentioned in the article were held by one or more of U.S. Global Investors family of funds as of 12-31-07 : streetTRACKS Gold Trust.
Frank Holmes Archive |
© 2005-2022 http://www.MarketOracle.co.uk - The Market Oracle is a FREE Daily Financial Markets Analysis & Forecasting online publication.