Stocks Bear Market Rally Topping Action Continues
Stock-Markets / Stock Markets 2010 Jan 18, 2010 - 04:16 PM GMTBy: Andre_Gratian
 Current Position of the Market
SPX: Long-term trend - Down! The very-long-term cycles have taken over and if they make their lows when expected, the bear market which started in October 2007 should continue until 2014. This would imply that lower prices lie ahead. As illustrated by the current market performance, this will not be a straight-down decline, but will consist of a series of intermediate-term rallies and declines until we have reached the low point.
SPX: Intermediate trend - The 1119.13 top achieved in early December remains the high of what is most likely a two-month distribution phase, but it may soon be challenged for the final time.
Analysis of the short-term trend is done on a daily basis with the help of hourly charts. It is an important adjunct to the analysis of daily and weekly charts which determines the course of longer market trends.
Daily market analysis of the short term trend is reserved for subscribers. If you would like to sign up for a FREE 4-week trial period of daily comments, please let me know at ajg@cybertrails.com .
Overview:
What better way to get an overview of the market’s position than by looking at a long-term chart? I’ll start this
week’s analysis by looking at the Monthly Chart of the SPX. Up above, under “Long-term trend”, I have
been saying for some time that it is down! I’ll explain what I mean by giving an opinion about the course of
the stock market for the next few years. This opinion is based on an evaluation of the current cyclic
configuration and a general application of Fibonacci and Elliott Wave structure to determine what pattern they
might create.
With respect to cycles, I have made a note of some of the dominant cycles in play of which I am aware -- thanks primarily to Bud Kress of “Sine Scope”. Many have been left out for the sake of simplicity. And then, of course, there are those of which I am not aware. For instance, I believe that the 6-yr cycle bottomed in November 2008, but I have no idea which one caused the March 2009 low. Whichever it was, it is responsible, in conjunction with the 6-year cycle, for the current rally which has surprised many by its strength.
As far as projections are concerned, we are currently in the target area of the rally from March 2009, give or take some 15 points, and the target of 1220 which should occur next year -- a very loose Fib. estimation for which I don’t have a specific date. This will be firmed-up as we go along with the help of daily and hourly charts. But the main point of this analysis is to show what lies ahead between now and 2014. The second leg of the bear market is expected to be far more serious than the first, because it will be the last 3 years of the bottoming 120-yr cycle and we will be lucky if, by then, we are still able to say that we are in a “severe recession”, instead of the “depression” that we have been trying to avoid.
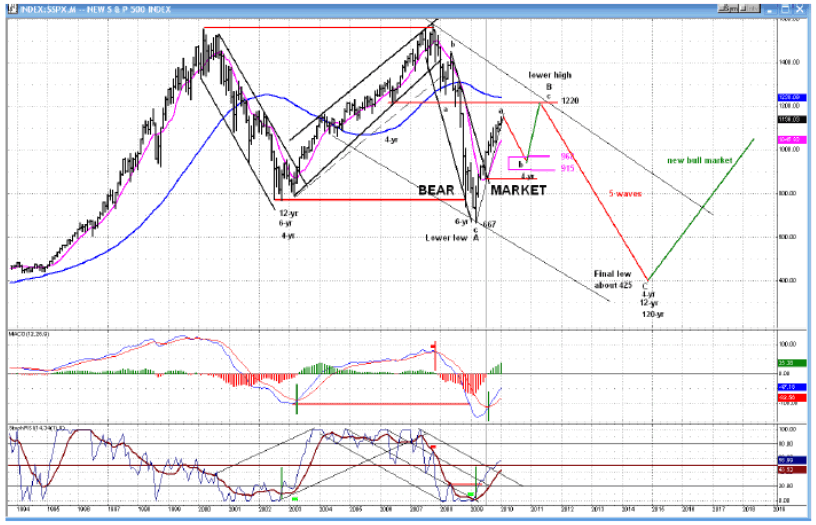
Turning to the indicators, they show no sign of a top (since it should come next year), but the lower one does show the beginning of deceleration, something which is much more evident on the weekly and daily charts that we will look at later.
How do we know that the long-term cycle low is still ahead of us and did not cause the debacle which occurred last year? We don’t for sure, but Kress believes that his cycles are exact and that the 120-year cycle should not bottom before 2014. Also, the SPX low of 2009 went lower than the low of 2002 and the MACD showed no sign of positive divergence at its low point, suggesting that the long-term trend is still in progress. Until we see clear positive divergence as we saw in the weekly chart at the bottom of the March 2009 low, we can assume that the long-term low is still ahead of us. The projection to about 425 assumes that we will go below the 667 low instead of making a prolonged sideways pattern which could be an alternative. In either case, no bull market until after 2014!
What's ahead?
Chart Pattern and Momentum
Now let’s leave the satellite view and look closer with the Weekly Chart. You see the pattern of the MACD at the market low? Something like this is what I would expect in the Monthly Chart at the final low of the SPX in 2014. Whether you are looking for a short-term or a long-term bottom or top, you usually find the same pattern of deceleration and divergence ahead of it. This is why we can pretty well assume that we are either at the top of the current rally, or very near it. Look at the weekly indicators! The bottom indicator, which is always ahead of the top one is screaming deceleration and negative divergence. The most obvious sign of deceleration is in the MACD histogram where the green has become almost imperceptible, and is about to turn red.
Next will come the breaking of the trend line to give us a sell signal. Currently, the price is merged with the trend line! As soon as we see it come out below the trend line, we’ll have a sell signal. I have labeled the move from 667 A-B-C-D-E only to indicate that it is a corrective pattern and not an impulse wave. I will let the EW experts label correctly. It consists of three consecutive zigzags, something which is fairly rare. There is no confirmation yet that it is complete, only a strong indication that it is in the projection area.
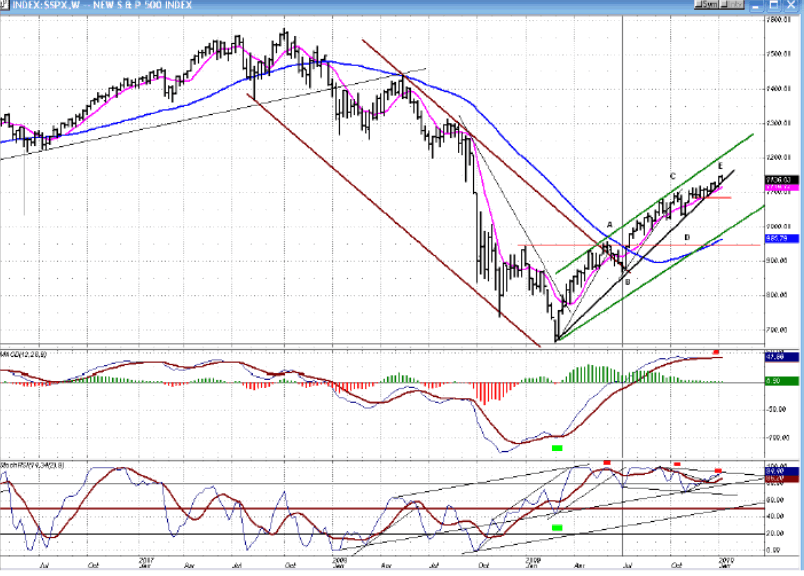
One more thing about this chart: I have done away with the wider channel, because I believe that it is irrelevant and confusing. The real channel of the downtrend is the one which is left. It represents the first down-phase of the bear market. The counter-trend rally which we are experiencing is the next phase, and should last until 2011 in the form of another corrective wave, probably a-b-c. We should be in the process of finishing “a”. (Please refer to the monthly chart).
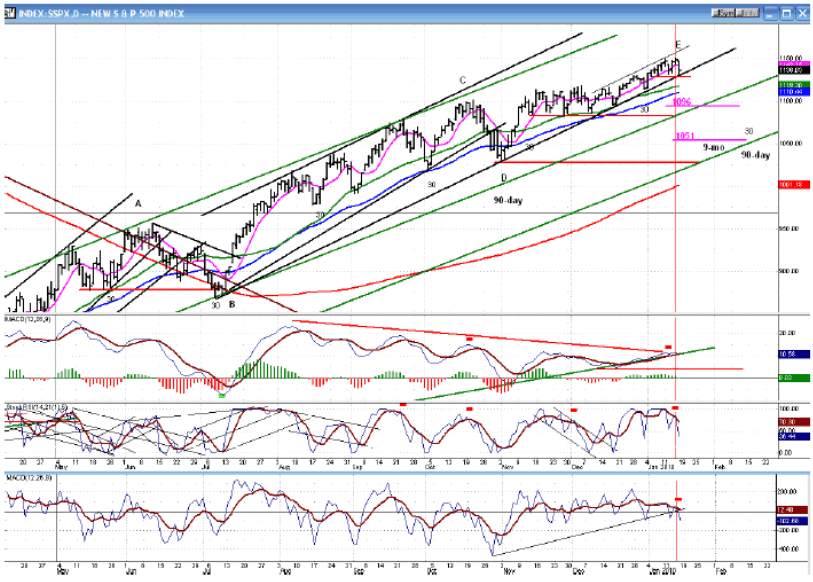
Now, we’ll turn to the Daily Chart to continue our analysis. We are still trading in the upper half of the green channel, but just barely as the index continues to challenge its trend line from July. On Friday, prices bounced off of it again and closed slightly above. Indicators suggest that the decline into the 90-day low may have begun, assisted by the 9-mo cycle which is bottoming ahead of it. If we follow through on Monday and close below the first horizontal red line (1130) we will have confirmation of a short-term top with a decline potential to 1096, followed by more decline to 1051 if we break below the second red line at 1083.
Let’s down-size one more time to the Hourly Chart for a better look. On Friday, the SPX made some good progress toward beginning a downtrend. It broke through 2 significant trend lines and its moving averages, and came to rest on the last trend line which is also shown on the above charts. If broken, the downtrend will have an initial objective of 1121, followed by the blue line which represents an open gap and good support at about 1116 and, if it keeps on going, another open gap and a projection to 1096-1100.
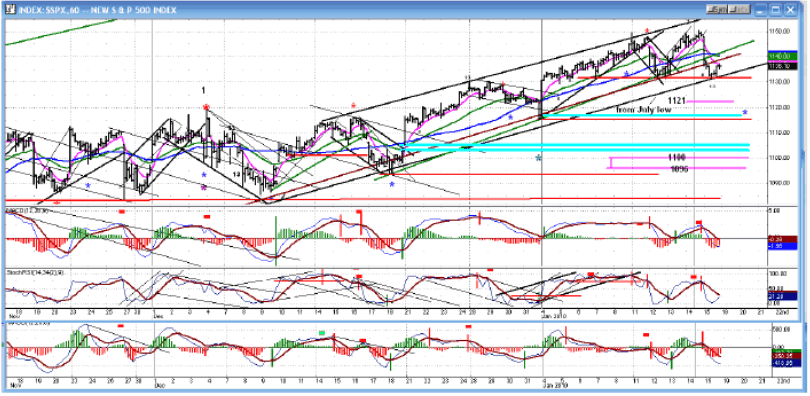
From Friday’s second top at 1150, the SPX came down in 5 short waves, and bounced in a small corrective wave. This is a good start for a decline, especially with the bottoming cycles pulling down at it; but to give a sell signal, it must now move decisively through the last trend line and below the red line at about 1131. If it does, we may have a decline to 1096 or lower.
Cycles
The longer cycles were discussed at the beginning of the letter. Of more immediate concern, are the 9-mo cycle bottoming about 2/1, and the 90-day cycle bottoming around mid-February.
Projections:
If the SPX decides to rally to one more high before rolling over, the target would be 1155-1160. If it is ready to roll over, the first target is 1121, followed by other potential targets to 1096 and 1051.
Breadth
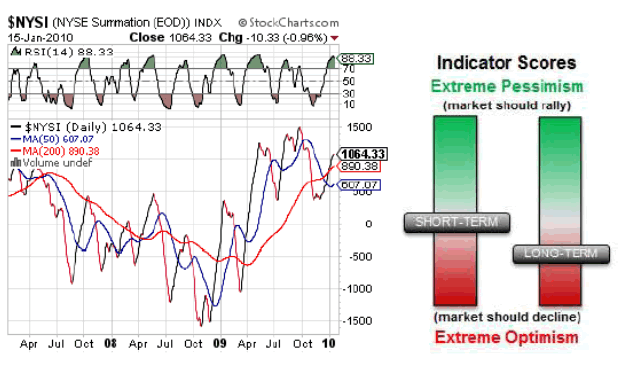
The NYSE Summation index (courtesy of StockCharts) has now reached overbought on its RSI. The rally in the SPX to its projection target has caused it to become overbought with severe negative divergence -- just what we need for a top. We now need for it to turn down for a sell signal.
Market Leaders and Sentiment
The long-term sentiment indicator (courtesy of SentimenTrader, above) is now in a position to give us at least a short-term top. The short-term is slightly negative and should not interfere if the market wants to move lower.
Summary
From the last letter, two weeks ago: “We may be about to start the last small thrust to a new high and reach the 1130-1135 SPX target that will mark the end of the rally which started in March 2009 at 667.” We did get the thrust to the projection and a little beyond.
The SPX is now ready to have a short-term decline which could be the start of something bigger. To suggest that we have started a move of intermediate nature, we would have to trade below 1030. More topping action may be needed before we are ready to do this.
Andre
The following are examples of unsolicited subscriber comments:
Awesome calls on the market lately. Thank you. D M
Your daily updates have taken my trading to the next level. D
… your service has been invaluable! It's like having a good technical analyst helping me in my trading. SH
I appreciate your spot on work more than you know! M
But don't take their word for it! Find out for yourself with a FREE 4-week trial. Send an email to ajg@cybertrails.com .
By Andre Gratian
MarketTurningPoints.com
A market advisory service should be evaluated on the basis of its forecasting accuracy and cost. At $25.00 per month, this service is probably the best all-around value. Two areas of analysis that are unmatched anywhere else -- cycles (from 2.5-wk to 18-years and longer) and accurate, coordinated Point & Figure and Fibonacci projections -- are combined with other methodologies to bring you weekly reports and frequent daily updates.
“By the Law of Periodical Repetition, everything which has happened once must happen again, and again, and again -- and not capriciously, but at regular periods, and each thing in its own period, not another’s, and each obeying its own law … The same Nature which delights in periodical repetition in the sky is the Nature which orders the affairs of the earth. Let us not underrate the value of that hint.” -- Mark Twain
You may also want to visit the Market Turning Points website to familiarize yourself with my philosophy and strategy.www.marketurningpoints.com
Disclaimer - The above comments about the financial markets are based purely on what I consider to be sound technical analysis principles uncompromised by fundamental considerations. They represent my own opinion and are not meant to be construed as trading or investment advice, but are offered as an analytical point of view which might be of interest to those who follow stock market cycles and technical analysis.
Andre Gratian Archive |
© 2005-2022 http://www.MarketOracle.co.uk - The Market Oracle is a FREE Daily Financial Markets Analysis & Forecasting online publication.


