Stock Market SPY Index Trading Buy Signal
Stock-Markets / Stock Index Trading Jan 18, 2010 - 02:42 AM GMTBy: Angelo_Campione
 Current Positioning: SPY: Long 50%
General Commentary: The system for the SPY is on a Buy signal ![]()
This stock market game is a funny one, while the universal truth is that we don't know what tomorrow brings, we try to work out some semblance of order through a given system to give us the best chances of positioning for success.
To me, the best way to approach the market is with humbleness, respecting the fact that I have no real knowledge of the future, but that I feel good and can trust the steps I take in this moment. If, when tomorrow comes, it turns out that the steps I took are taking me somewhere that no longer feels right, I can accept what is and simply change direction without guilt or blame
Just something to think about.
So back to the task at hand, the market was choppy last week as expected, we're now approaching a key crossroad point. 1150 kept a ceiling on prices last week and we have support at around 1130, one of these points will have to give in the near term.
Our system has shifted into buy, and so the potential for a continued rise into March is increasing. A potential scenario is that we get a quick drop to around 1110 to shake things up a little, and then continue higher into March.
Let's see what the coming week brings.
SPX Chart - Bigger Picture

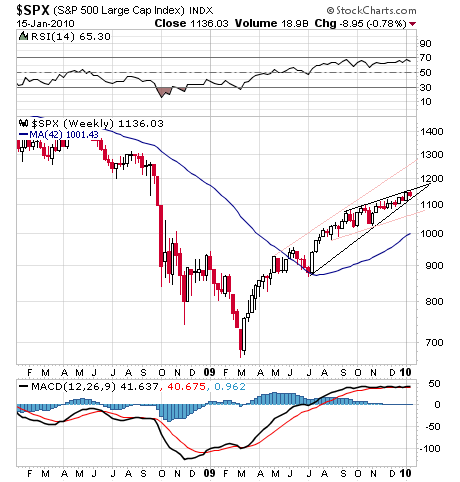
The bigger picture shows the market clearly continuing to trace the rising bearish wedge.
At this point, if we get a break to the downside, we'll probably find support around the 1070-1080 level. On the other hand, a break to the upside will go to the 1200 level before meeting more resistance.
The feint lines show the potential paths we're looking at for the next break.
SPX Chart - Shorter Picture

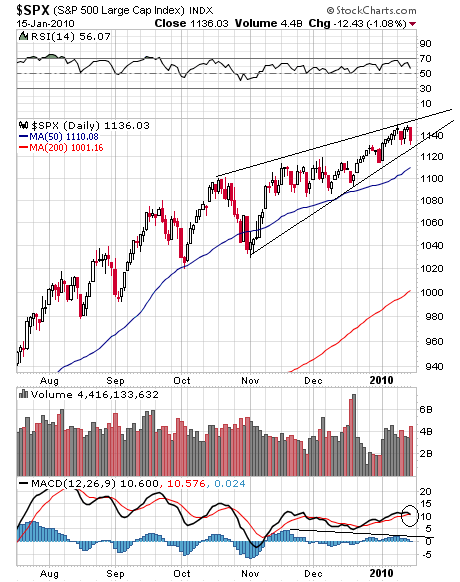
The shorter term shows the leeway we have within the rising bearish wedge and so potentially the week ahead could see a range between here and 1160.
The MACD is giving the potential for a turn lower here, but this has not been so reliable lately.
For the week ahead, support on the SPX is 1115 - 1130 and resistance is 1150 - 1160.
The VIX Picture

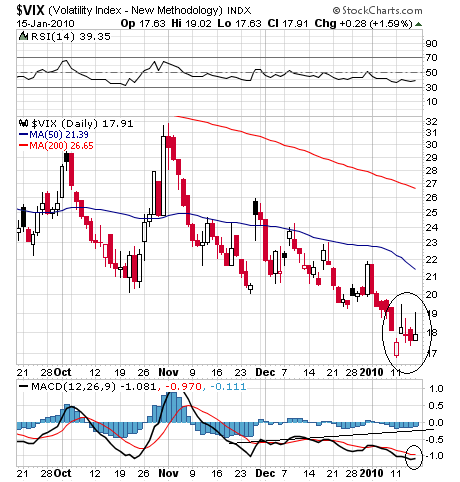
The VIX continues to show that the market is getting quite comfortable with higher prices, i.e. complacency.
Positive divergence is still present on the MACD histogram and the linear MACD also has potential to turn higher here. There's a reasonable chance for a pop higher during the week and therefore a drop in the markets but whether it's sustained is another question.
The VIX measures the premiums investors are willing to pay for option contracts and is essentially a measure of fear i.e. the higher the VIX, the higher the fear in the market place. It tends to move inversely with the markets.
Performance
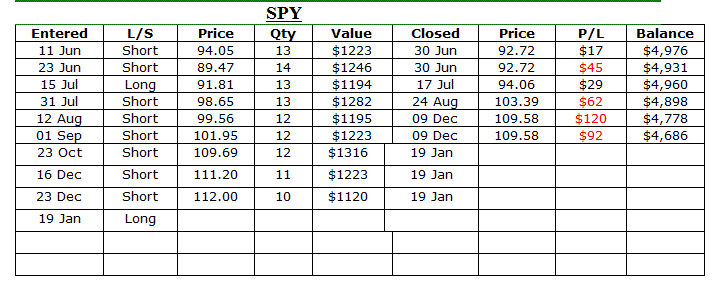
We're using a starting capital of $5,000 and allocations are based on 25% of this or the remaining balance.

Feel free to email me at angelo@stockbarometer.com if you have any questions or comments.
If you are receiving these alerts on a free trial, you have access to all of our previous articles and recommendations by clicking here. If you do not recall your username and/or password, please email us at customersupport@stockbarometer.com. If you are interested in continuing to receive our service after your free trial, please click here.
By Angelo Campione
Important Disclosure
Futures, Options, Mutual Fund, ETF and Equity trading have large potential rewards, but also large potential risk. You must be aware of the risks and be willing to accept them in order to invest in these markets. Don't trade with money you can't afford to lose. This is neither a solicitation nor an offer to buy/sell Futures, Options, Mutual Funds or Equities. No representation is being made that any account will or is likely to achieve profits or losses similar to those discussed on this Web site. The past performance of any trading system or methodology is not necessarily indicative of future results.
Performance results are hypothetical. Hypothetical or simulated performance results have certain inherent limitations. Unlike an actual performance record, simulated results do not represent actual trading. Also, since the trades have not actually been executed, the results may have under- or over-compensated for the impact, if any, of certain market factors, such as a lack of liquidity. Simulated trading programs in general are also subject to the fact that they are designed with the benefit of hindsight. No representation is being made that any account will or is likely to achieve profits or losses similar to those shown.
Investment Research Group and all individuals affiliated with Investment Research Group assume no responsibilities for your trading and investment results.
Investment Research Group (IRG), as a publisher of a financial newsletter of general and regular circulation, cannot tender individual investment advice. Only a registered broker or investment adviser may advise you individually on the suitability and performance of your portfolio or specific investments.
In making any investment decision, you will rely solely on your own review and examination of the fact and records relating to such investments. Past performance of our recommendations is not an indication of future performance. The publisher shall have no liability of whatever nature in respect of any claims, damages, loss, or expense arising out of or in connection with the reliance by you on the contents of our Web site, any promotion, published material, alert, or update.
For a complete understanding of the risks associated with trading, see our Risk Disclosure.
© 2010 Copyright Angelo Campione - All Rights Reserved
Disclaimer: The above is a matter of opinion provided for general information purposes only and is not intended as investment advice. Information and analysis above are derived from sources and utilising methods believed to be reliable, but we cannot accept responsibility for any losses you may incur as a result of this analysis. Individuals should consult with their personal financial advisors.
© 2005-2022 http://www.MarketOracle.co.uk - The Market Oracle is a FREE Daily Financial Markets Analysis & Forecasting online publication.


