Most Popular
1. It’s a New Macro, the Gold Market Knows It, But Dead Men Walking Do Not (yet)- Gary_Tanashian
2.Stock Market Presidential Election Cycle Seasonal Trend Analysis - Nadeem_Walayat
3. Bitcoin S&P Pattern - Nadeem_Walayat
4.Nvidia Blow Off Top - Flying High like the Phoenix too Close to the Sun - Nadeem_Walayat
4.U.S. financial market’s “Weimar phase” impact to your fiat and digital assets - Raymond_Matison
5. How to Profit from the Global Warming ClImate Change Mega Death Trend - Part1 - Nadeem_Walayat
7.Bitcoin Gravy Train Trend Forecast 2024 - - Nadeem_Walayat
8.The Bond Trade and Interest Rates - Nadeem_Walayat
9.It’s Easy to Scream Stocks Bubble! - Stephen_McBride
10.Fed’s Next Intertest Rate Move might not align with popular consensus - Richard_Mills
Last 7 days
It's Five Nights at Freddy's Again! - 12th Jan 25
Squid Game Stock Market 2025 - 5th Jan 25
Stock Market Bubble Drivers, Crypto Exit Strategy During Musk Presidency - 27th Dec 24
Gold Stocks’ Remain Exceptionally Weak Even as Stocks Rise - 27th Dec 24
Gold’s Remarkable Year - 27th Dec 24
Stock Market Rip the Face Off the Bears Rally! - 22nd Dec 24
STOP LOSSES - 22nd Dec 24
Fed Tests Gold Price Upleg - 22nd Dec 24
Stock Market Sentiment Speaks: Why Do We Rely On News - 22nd Dec 24
Never Buy an IPO - 22nd Dec 24
THEY DON'T RING THE BELL AT THE CRPTO MARKET TOP! - 20th Dec 24
CEREBUS IPO NVIDIA KILLER? - 18th Dec 24
Nvidia Stock 5X to 30X - 18th Dec 24
LRCX Stock Split - 18th Dec 24
Stock Market Expected Trend Forecast - 18th Dec 24
Silver’s Evolving Market: Bright Prospects and Lingering Challenges - 18th Dec 24
Extreme Levels of Work-for-Gold Ratio - 18th Dec 24
Tesla $460, Bitcoin $107k, S&P 6080 - The Pump Continues! - 16th Dec 24
Stock Market Risk to the Upside! S&P 7000 Forecast 2025 - 15th Dec 24
Stock Market 2025 Mid Decade Year - 15th Dec 24
Sheffield Christmas Market 2024 Is a Building Site - 15th Dec 24
Got Copper or Gold Miners? Watch Out - 15th Dec 24
Republican vs Democrat Presidents and the Stock Market - 13th Dec 24
Stock Market Up 8 Out of First 9 months - 13th Dec 24
What Does a Strong Sept Mean for the Stock Market? - 13th Dec 24
Is Trump the Most Pro-Stock Market President Ever? - 13th Dec 24
Interest Rates, Unemployment and the SPX - 13th Dec 24
Fed Balance Sheet Continues To Decline - 13th Dec 24
Trump Stocks and Crypto Mania 2025 Incoming as Bitcoin Breaks Above $100k - 8th Dec 24
Gold Price Multiple Confirmations - Are You Ready? - 8th Dec 24
Gold Price Monster Upleg Lives - 8th Dec 24

Market Oracle FREE Newsletter

How to Protect your Wealth by Investing in AI Tech Stocks

USD/JPY Bulls Pause for Thought

Currencies / Forex Trading Jan 18, 2010 - 02:05 AM GMT

By: Seven_Days_Ahead

Currencies

Best Financial Markets Analysis ArticleThe downmove in 2009 culminated in an acceleration in November, below prior 87.11 Dec-08/Jan-09 lows, which seemed to justify a bearish stance. However, an equally rapid recovery led us to think that we might have seen a blow-off move, and subsequent action supports this view – s/term weakness may not, therefore, be long-lasting.


The FX Trader’s view
MONTHLY CHART:

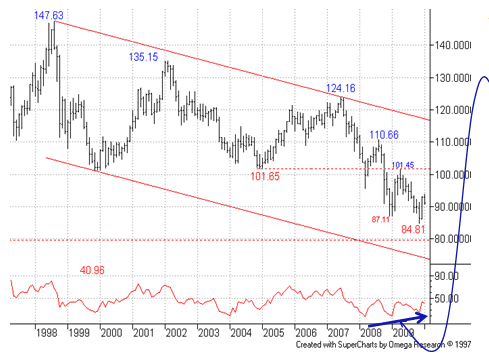
In the FX Specialist Guide we have started to look at a positive divergence on the monthly RSI indicator now visible – the implication is that long term bear enthusiasm is on the wane.  


WEEKLY CHART:

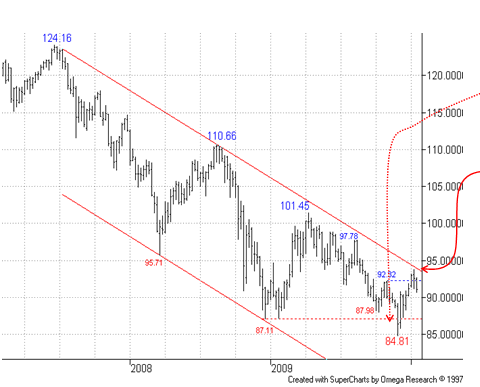
The break below the 87.11 lows was deceptive – but such false breaks can be turned to advantage.

Note that key long term falling resistance is currently around 93.80, and a decent Weekly close above this would provide a further bull signal.


DAILY CHART:

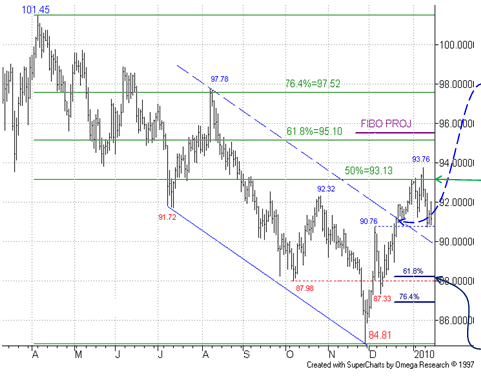
The break above the 90.76 04-Dec high and bear channel top projection supported our thinking that bears had enjoyed a blow-off finale in Nov.

S/term resistance around the 50% recovery level has been seen, but we view s/term weakness as probably temporary ahead of another bull attempt.

First support from that 90.76 high has come under pressure today – below this note in particular the 88.23/87.96 support area, 61.8% pullback and Oct low.

It is unclear if losses can extend to the lower 86.92 76.4% level.

A subsequent break above the 93.76 08-Jan high (and, therefore, above long term falling resistance on the Weekly chart) would next turn our focus on the 95.10/50 area, 61.8% recovery and Fibo projection.

Philip Allwright
Mark Sturdy

Seven Days Ahead
Be sure to sign up for and receive these articles automatically at Market Updates

Mark Sturdy, John Lewis & Philip Allwright, write exclusively for Seven Days Ahead a regulated financial advisor selling professional-level technical and macro analysis and high-performing trade recommendations with detailed risk control for banks, hedge funds, and expert private investors around the world. Check out our subscriptions.

© 2010 Copyright Seven Days Ahead - All Rights Reserved
Disclaimer: The above is a matter of opinion provided for general information purposes only and is not intended as investment advice. Information and analysis above are derived from sources and utilising methods believed to be reliable, but we cannot accept responsibility for any losses you may incur as a result of this analysis. Individuals should consult with their personal financial advisors.

Seven Days Ahead Archive

© 2005-2022 http://www.MarketOracle.co.uk - The Market Oracle is a FREE Daily Financial Markets Analysis & Forecasting online publication.


Post Comment

Only logged in users are allowed to post comments. Register/ Log in