Dow Jones (YM, CBOT) Options Trade Alert
Stock-Markets / Options & Warrants Jan 17, 2010 - 08:51 PM GMT Welcome to The J.E.D.I. Way.
The J.E.D.I. Way will be buying the following call option on the MINI-SIZED DOW JONES (YM, CBOT) at the Market:
(1) 1 - Mini-Sized Dow Jones MARCH 2010 10,900 Call Option (Ticker Symbol: YMH111450C)
The J.E.D.I. Way will also be buying the following put option on the MINI-SIZED DOW JONES (YM, CBOT) at the Market:
(1) 1 - Mini-Sized Dow Jones MARCH 2010 9000 Put Option (Ticker Symbol: YMH19000P)
Below is The J.E.D.I. Way's "SET-UP CRITERIA" and "ENTRY-ALERT" for the above listed options on the April 2010, June 2010, and August 2010 Nymex Gold:
SETUP: PRICES MOVING OUTSIDE OF A PRICE CHANNEL
Buy Call Options on the March 2010 Mini-Sized Dow Jones (YM, CBOT) when the following conditions have been satisified:
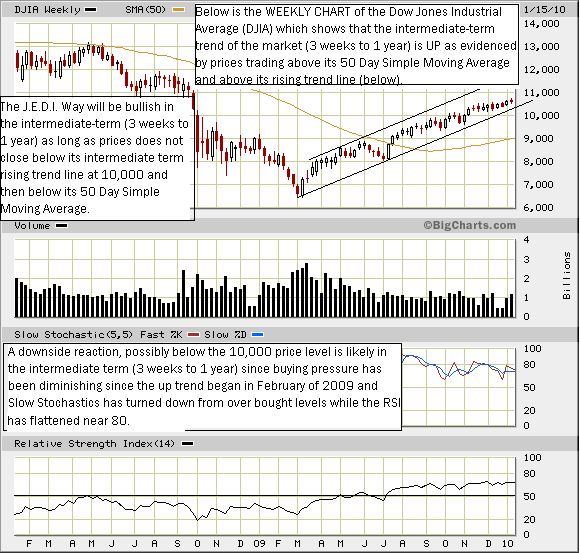
(1) The 50 Day Moving Average is trading above its 200 Day Moving Average on the WEEKLY CHARTS for the Dow Jones Industrial Average contracts.
(2) Prices on the Dow Jones Industrial Average trades above both their 50-Day Moving Average and their 200 Day Moving Average.
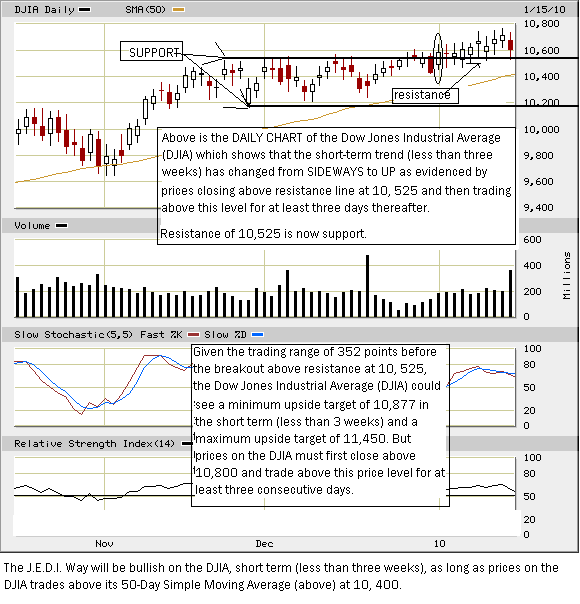
(3) Prices on the Dow Jones Industrial Average close above its short-term resistance line at 10,525 and thus outside of its price channel and trades above the price level of 10,525 for at least 3 consecutive days thereafter.
CHART 1:

CHART 2:

ESTIMATED COST:
($270.00) - $85 FOR BUYING THE CALL OPTION; $165 FOR BUYING THE PUT OPTION; $20 IN COMMISSIONS
ESTIMATED BREAKEVEN (w/$20.00 commissions per round turn):
$105.00 (or 21) for the March 2010 Mini-Sized Dow Jones Call Option
$185 (or 41) for the March 2010 Mini-Sized Dow Jones Put Option
ESTIMATED UPSIDE TARGET FOR 2010 MINI-SIZED DOW JONES FUTURES: $11,450 ESTIMATED DOWNSIDE TARGET FOR 2010 MINI-SIZED DOW JONES FUTURES: $8000 MAX GAIN FOR DOING THESE TRADES: Unlimited MAX LOSS FOR DOING THESE TRADES: $290.00
PROTECTIVE STOPS FOR THE CALL OPTIONS:
None for the March 2010 Mini-Sized Dow Jones 11,450 Call
PROTECTIVE STOPS FOR THE PUT OPTIONS:
None for the March 2010 Mini-Sized Dow Jones 9,000 Put
EXITS:
The J.E.D.I. Way will exit the March 2010 Mini-Dow Jones 11,450 call at breakeven or better, otherwise take a loss of $105.00 for this options contract.
The J.E.D.I. Way will exit the March 2010 Mini-Dow Jones 9,000 put at breakeven or better, othewise take a loss of $185.00 for this options contract.
EXPIRATIONS:
The March 2010 Options expire on March 19, 2010.
CONTRACT SPECIFICATIONS FOR MINI-SIZED DOW JONES FUTURES OPTIONS:
Price Value of Option Point: $5
CONTRACT SPECIFICATIONS FOR MINI-SIZED DOW JONES (YM, CBOT) FUTURES: Contract Specifications:YM,CBOT
| Trading Unit: | ($5.00) times the Dow Jones Industrial AverageSM Index. |
| Tick Size: | One point ($5.00 per contract) |
| Quoted Units: | DJIA index points |
| Initial Margin: | $3,503 Maint Margin: $2,802 |
| Contract Months: | Mar, Jun, Sep, Dec |
| First Notice Day: | Not applicable (cash settled contract) |
| Last Trading Day: | The trading day preceding the third Friday of the contract month. |
| Trading Hours: | 5:00 p.m. to 4:30 p.m. Central Time, Sunday - Friday. Trading in expiring contracts ceases at 3:15 p.m. Central Time on the last trading day |
| Daily Limit: | Successive 10%, 20%, and 30% limits. |
Until next time...
Thanks for listening, and good luck with your trading.
Best Regards,
Patrice V. Johnson
E-mail : Patrice@stockbarometer.com if you have any questions about this trade or any other questions or comments.
If you are interested in continuing to receive our advice as your free trial, please click the following link to subscribe.
http://www.stockbarometer.com/pagesJEDI/learnmore.aspx
Important Disclosure
Futures, Options, Mutual Fund, ETF and Equity trading have large potential rewards, but also large potential risk. You must be aware of the risks and be willing to accept them in order to invest in these markets. Don't trade with money you can't afford to lose. This is neither a solicitation nor an offer to buy/sell Futures, Options, Mutual Funds or Equities. No representation is being made that any account will or is likely to achieve profits or losses similar to those discussed on this Web site. The past performance of any trading system or methodology is not necessarily indicative of future results.
Performance results are hypothetical. Hypothetical or simulated performance results have certain inherent limitations. Unlike an actual performance record, simulated results do not represent actual trading. Also, since the trades have not actually been executed, the results may have under- or over-compensated for the impact, if any, of certain market factors, such as a lack of liquidity. Simulated trading programs in general are also subject to the fact that they are designed with the benefit of hindsight. No representation is being made that any account will or is likely to achieve profits or losses similar to those shown.
Investment Research Group and all individuals affiliated with Investment Research Group assume no responsibilities for your trading and investment results.
Investment Research Group (IRG), as a publisher of a financial newsletter of general and regular circulation, cannot tender individual investment advice. Only a registered broker or investment adviser may advise you individually on the suitability and performance of your portfolio or specific investments.
In making any investment decision, you will rely solely on your own review and examination of the fact and records relating to such investments. Past performance of our recommendations is not an indication of future performance. The publisher shall have no liability of whatever nature in respect of any claims, damages, loss, or expense arising out of or in connection with the reliance by you on the contents of our Web site, any promotion, published material, alert, or update.
For a complete understanding of the risks associated with trading, see our Risk Disclosure.
© 2010 Copyright Patrice V. Johnson - All Rights Reserved
Disclaimer: The above is a matter of opinion provided for general information purposes only and is not intended as investment advice. Information and analysis above are derived from sources and utilising methods believed to be reliable, but we cannot accept responsibility for any losses you may incur as a result of this analysis. Individuals should consult with their personal financial advisors.
© 2005-2022 http://www.MarketOracle.co.uk - The Market Oracle is a FREE Daily Financial Markets Analysis & Forecasting online publication.


