Stocks and Gold and Commodity Trends Impacted by China Inflation Worries
Stock-Markets / Financial Markets 2010 Jan 17, 2010 - 04:58 PM GMT The big news this week was that China’s Central Bank – the People’s Bank of China (BOC), raised the reserve deposit rate on funds held under account by 50 basis points, starting Jan. 18. So, why did the BOC feel the need to raise the rate?
Well, let’s take a look at China’s recent credit reports, and see what’s been going on. In November of 2009, China’s banks lent out 295 billion Yuan in total. Last week, the banks lent about 100 billion Yuan ($14.6 billion) PER DAY – EVERY DAY.
The BOC is worried that inflation may rear its ugly head, via higher prices and or asset bubbles. Where have we heard that before? Many warned of asset bubbles and boom & bust cycles years ago, but did anyone listen? – No they didn’t. Greenspan didn’t know what a bubble looked like, or at least he would not admit it.
Considering that almost 10 trillion Yuan worth of loans were made in 2009, and there seems to be a myriad of reasons why inflation concerns are warranted. But wait – China’s stock market, which has been leading the world markets for years, is suddenly underperforming. What’s going on?
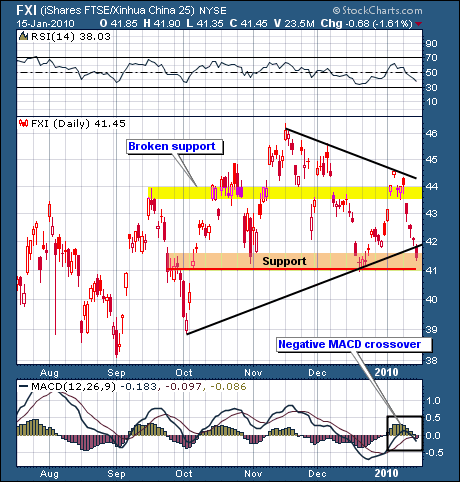
Whatever it is, it isn’t good, as it feels and smells like toxic waste that paper fiat money engenders. The odor was enough to send global stock markets down, along with most commodity markets, including gold and silver. Up first is the chart of China’s stock market, via the FXI ETF. If support at 41 does not hold, it will not be a good omen for world markets.
Stocks
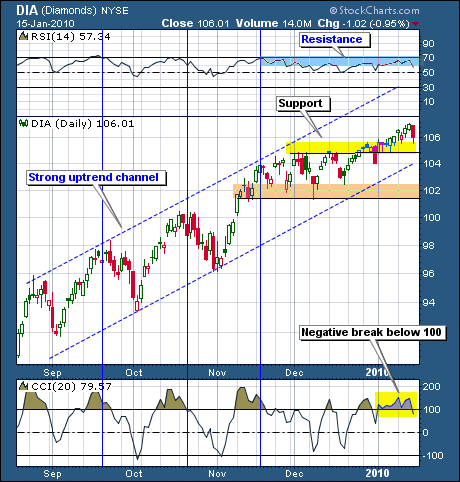
Stocks were down less than 1% for the week. Before closing down on Friday, the Dow made another new high mid-week, and as the chart below shows, it is in a pronounced uptrend.
With the Dow Diamonds, first support is around 105, with more significant support below at 102. RSI has turned down and the CCI index at the bottom of the chart has declined from overbought to below 100. The blue vertical lines on the chart connect past corrections with such readings.
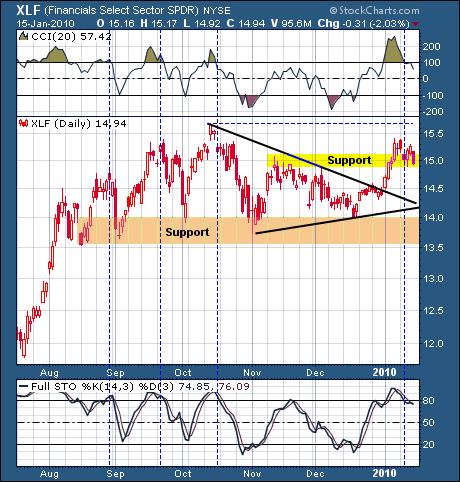
The financials (XLF) have been acting better as of late. They broke out of a symmetrical triangle at the end of 2009, and are now consolidating their recent gain. They have not, however, been able to reach their Oct. highs.
CCI has broken down well below the 100 area, and STO has crossed below 80. These could be the first signs of a possible correction. XLF does have the look of a broadening top formation, especially if a new high is not made.
Currencies
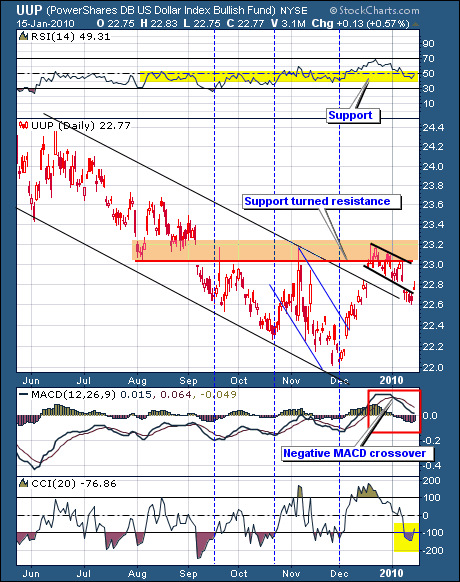
Last week’s report mentioned that the dollar had formed a falling flag formation, and that whichever way it broke out of the flag would have repercussions in other markets. It was also stated that the dollar could give back 50% of its recent rally, or drop to 22.5, and still resume its upward rally.
The dollar did in fact break below the flag, and moved down to 22.6, where it found support. It has now moved back up into the flag formation. It remains to be seen if the dollar can break out and above resistance at 23.
If any sustained dollar rally is to occur, a positive MACD crossover is needed. So, far CCI has moved from oversold readings of -100 to -77, suggesting that downside momentum is waning.
A breakout above the flag would be bullish for the dollar and bearish for gold and other commodities; all of which are showing corrective pattern set-ups, as will be shown.
The dollar does not, as of now, show any signs of having decoupled from other markets. As a matter of fact – the dollar may be directing the course of the other markets.
Up first is the daily chart of the UUP index. It shows the dollar’s major downtrend and the flag formation discussed above.
Note the blue vertical lines connecting CCI from oversold readings with past rallies. CCI has been a good signal when coupled with MACD crossovers and RSI.
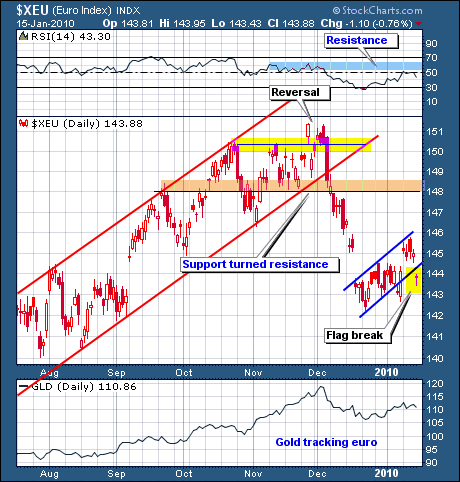
Next up is the Euro index. The euro & gold tend to move in the same direction, while the dollar & the euro trend in opposite directions.
On the daily chart below, the euro’s uptrend from August to Dec. is clearly indicated. In Dec. the euro broke down and below its rising price channel (149-148).
From there the euro fell to a low around 142, and has since rallied back up, forming a rising flag. Now, it has gapped down below the flag formation. This suggests more downside is coming.
Commodities
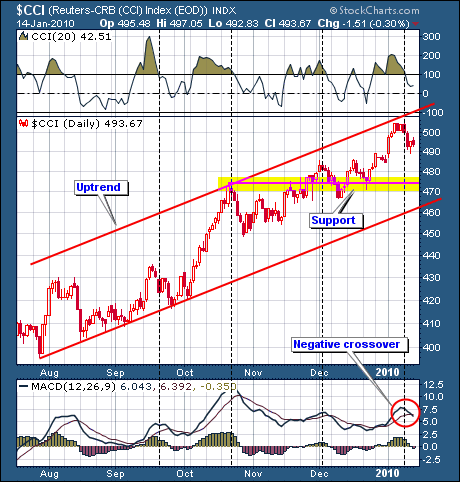
The daily chart of the CCI index (equal weighting) shows the strong uptrend that is in place – until such time that it isn’t. This doesn’t preclude it from having counter-trend moves or corrections.
Note the black dotted vertical lines that connect CCI overbought readings that drop below 100, with the beginnings of past corrections and negative MACD crossovers at the bottom of the chart.
We may be at one of those junctures now. The histograms have turned negative as well. Horizontal support is noted by the yellow band near 475, with further support offered by the lower diagonal channel trend line (460).
Gold
Gold fell -$6.40 to close the week out at $1130.90 for a loss of -0.56%. Since its high of 1226.40 on Dec. 3, 2009, gold has lost about -8%. Considering that gold gained over 20% just from Oct. to Dec., this correction is quite normal, and is of no surprise to regular readers. In the Nov. 27th report I wrote:
During November, gold’s rally has been parabolic. The ascent has become quite steep. A correction/consolidation would be a healthy occurrence for gold’s longer term perspective. Some backing and filling would provide a stronger base from which to move ahead. As of now, the trend remains up, but risk versus reward is increasing [Nov. 27, 2009 report].
Gold started to correct from its all-time highs the following week. The $64,000 question now is whether this is the end to gold’s correction; or if there is more to come. As stated in this and last week’s report, a lot depends on how the dollar and gold resolve their respective flag formations.
We have already discussed that the dollar originally broke below its flag formation (see currency section). Subsequently, however, the dollar regained the lost ground. Price is back within the flag’s parallel lines.
Now it remains to be seen if the dollar can break up and out of the formation; or if it fails once again. A dollar rally would put a head wind to gold. Also, the euro chart looks like it is breaking down, which if it occurs, will put additional pressure on gold.
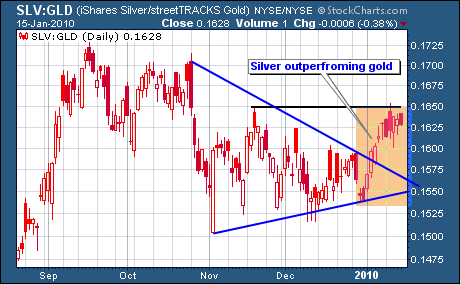
The detailed analysis of gold and silver we must leave for our full time subscribers. Needless, to say, gold is at an important juncture at this time; as are several other markets. Worthy of note is that silver is presently outperforming gold; and gold is outperforming the pm stocks. The charts below show these relationships. For those wishing to receive a free trial subscription that covers gold and silver in much greater detail, as well as the other markets, send your request to dvg6@comcast.net.

Above: Hui/Gold ratio shows gold stocks underperforming physical since Sept.; while below, silver can be seen to be outperforming gold since the start of the New Year.
Good luck. Good trading. Good health, and that’s a wrap.

Come visit our website: Honest Money Gold & Silver Report
New Audio-Book Now Available - Honest Money
Douglas V. Gnazzo
Honest Money Gold & Silver Report
About the author: Douglas V. Gnazzo writes for numerous websites and his work appears both here and abroad. Mr. Gnazzo is a listed scholar for the Foundation for the Advancement of Monetary Education (FAME).
Disclaimer: The contents of this article represent the opinions of Douglas V. Gnazzo. Nothing contained herein is intended as investment advice or recommendations for specific investment decisions, and you should not rely on it as such. Douglas V. Gnazzo is not a registered investment advisor. Information and analysis above are derived from sources and using methods believed to be reliable, but Douglas. V. Gnazzo cannot accept responsibility for any trading losses you may incur as a result of your reliance on this analysis and will not be held liable for the consequence of reliance upon any opinion or statement contained herein or any omission. Individuals should consult with their broker and personal financial advisors before engaging in any trading activities. Do your own due diligence regarding personal investment decisions. This article may contain information that is confidential and/or protected by law. The purpose of this article is intended to be used as an educational discussion of the issues involved. Douglas V. Gnazzo is not a lawyer or a legal scholar. Information and analysis derived from the quoted sources are believed to be reliable and are offered in good faith. Only a highly trained and certified and registered legal professional should be regarded as an authority on the issues involved; and all those seeking such an authoritative opinion should do their own due diligence and seek out the advice of a legal professional. Lastly Douglas V. Gnazzo believes that The United States of America is the greatest country on Earth, but that it can yet become greater. This article is written to help facilitate that greater becoming. God Bless America.
Douglas V. Gnazzo © 2009 All Rights Reserved
© 2005-2022 http://www.MarketOracle.co.uk - The Market Oracle is a FREE Daily Financial Markets Analysis & Forecasting online publication.


