The American Economy, Weak Economic Recovery 2010
Economics / Economic Recovery Jan 17, 2010 - 04:25 AM GMTBy: G_Abraham
 A Introspect and Mull - In my continuing series of analyzing country data and macro balances, I present the American economy and the long term patterns. My previous post was on India: Why am I so Bullish on India?
The American dream has been under severe test over the last 2 years. Many have written it off while there are a few contrarians who have emerged lately speaking about the recovery. This serves to be a good time to look at where exactly does the country stand. I have not done a relative comparison of America to other countries specifically to EU nations but I promise to post that analysis as soon as I find some time. My thesis is that EU will lead the world to a stable financial system irrespective of Greece, Spain, Ireland, courtesy EU’s stable relationship and trade with Arabs, Israel, India and China. EU has the least debt burden and it is being led by an export superpower, Germany. In the latest analysis from PIMCO, Gross encourages investors to go to Germany. EU is now politically stable and has full time president. More on this later….(subscribe so that you will be updated).
Right getting down to some number crunching on the US economy.
Financial Sector
The following chart gives us a view on how ingrained the financial services industry has itself into the American Economy. Given this chart, there really was very little option before the American senate last year but to approve the TARP of $700 bn. Am sure you have all heard of the whipping the american government has got for sending down billion of tax payer money to these thieves, but then what were the options given they were facing the void of nearly 6% of the American Gross product?
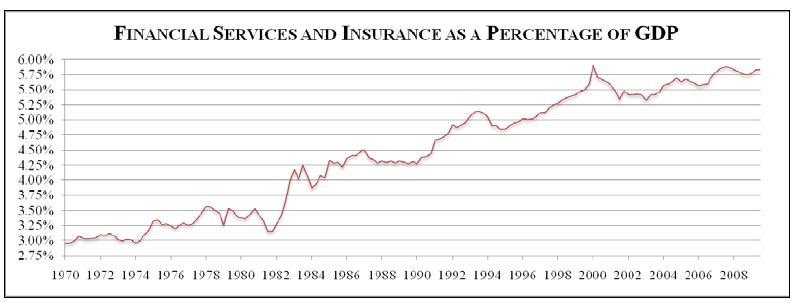
The financial sector has become an increasingly large part of the economy, reaching 5.8% of GDP in the third quarter of 2009.
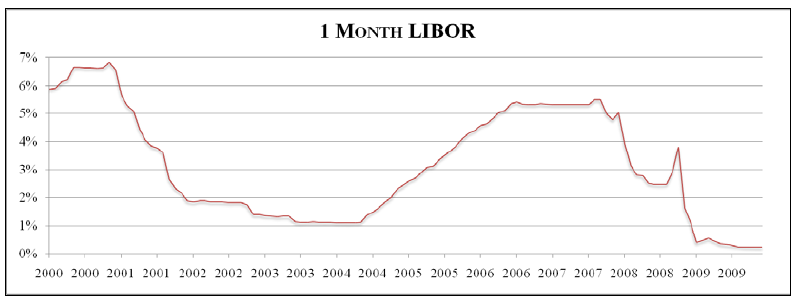
Short-term interbank funding markets have improved. For example, the 1-month LIBOR rate (the rate at which banks borrow unsecured funds from each other) is usually quite close to the Federal Funds rate. On September 15, 2008, the 1-month LIBOR rate was 2.50%, and the Federal Funds rate was 2.00%. By October 9, the 1-month LIBOR rate had jumped to 4.51%, while the Federal Funds rate had been cut to 1.50%. The LIBOR rate has been relatively stable since December 2008 and now stands at about 0.25%, while the Federal Funds rate target has been cut to between 0% and 0.25%.
According to the Federal Reserve’s most recent October 2009 survey of senior loan officers, “domestic banks indicated that they continued to tighten standards and terms over the past three months on all major types of loans to businesses and households.”
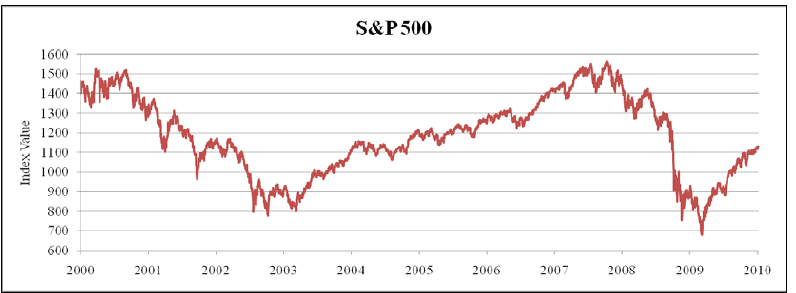
The S&P 500 index ended 2007 at a level of about 1500. In 2008, the index fell 40%, reaching about 900 by the end of the year. In early 2009, the index fell further, reaching a low of about 680, for an overall decline of 55% since the end of 2007. Since then, the stock market has partly recovered, with the S&P 500 rising to about 1150 as of January 8.
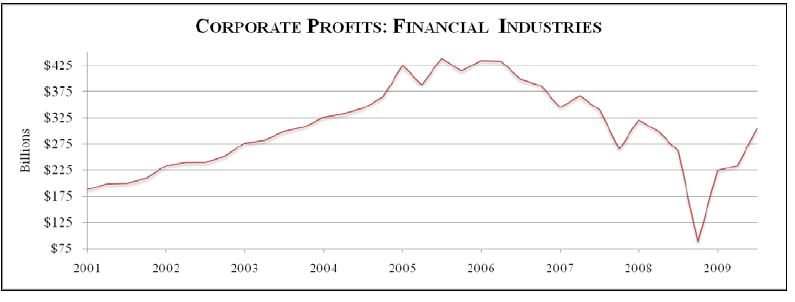
Financial sector corporate profits have also improved since the depths of the crisis. After rising from $199 billion in 2001 to $417 billion in 2005, profits fell to a recent low of $89 billion at an annual rate in 2008Q4. Since then, financial sector profits have risen and were $305 billion at an annual rate in the latest data from 2009Q3
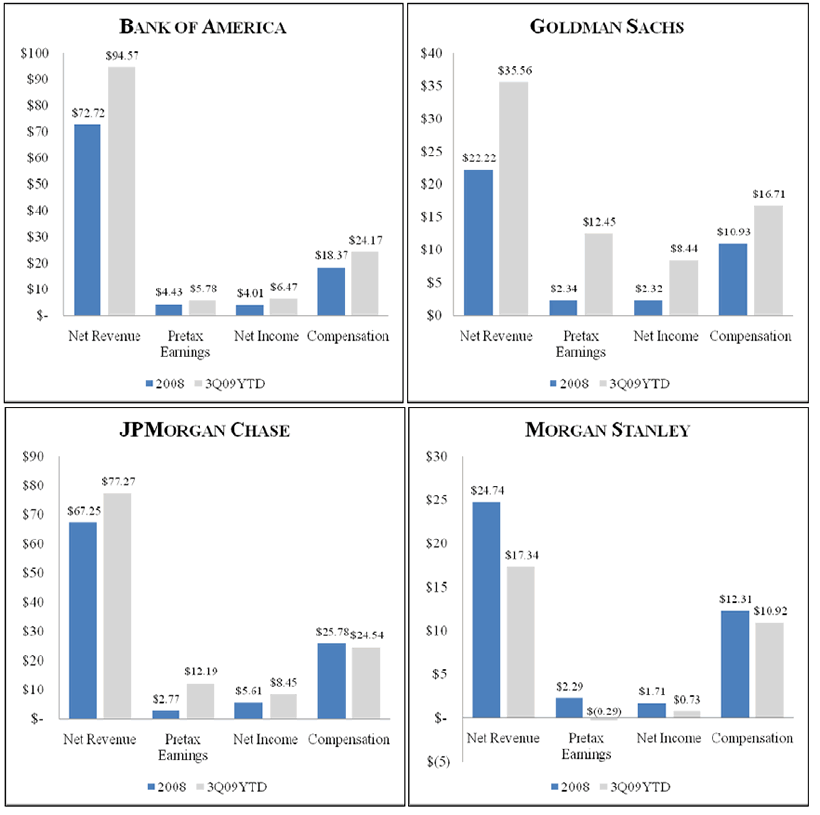
In general, for Goldman Sachs, JP Morgan, and Bank of America, net revenue, pretax earnings, net income, and compensation are up in the latest figures relative to 2008. In contrast, Morgan Stanley has seen declines in all four areas.
The American Household
Consumer spending accounts for over 70% of Gross Domestic Product (GDP), the market value of goods and services produced in the United States, and is one of the most closely watched indicators of economic activity. In 2008, consumer spending, adjusted for inflation, fell by the largest amount since the Great Depression and for the first time since 1980. This decline was a primary cause of the 1.9% drop in real GDP growth in 2008, the worst year since 1974.
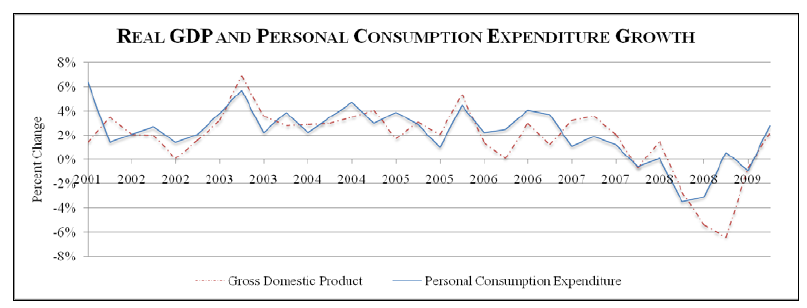
Since 2008, consumer spending has mostly stabilized. In fact, real consumer spending rose 2.8% at an annual rate in the third quarter, boosted by strong sales of motor vehicles reflecting the popular “Cash-for-Clunkers” program. More recently, retail sales (excluding autos and gasoline, a useful gauge of the underlying strength in consumer spending) was up 0.6%, following a 0.1% uptick in October.
In the latest data, real GDP grew at an annual rate of 2.2% in the third quarter of 2009.
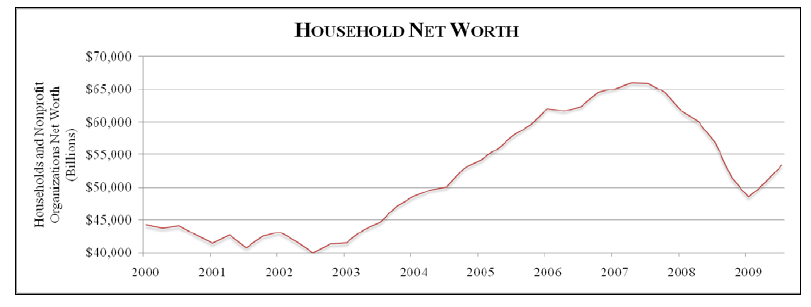
But the personal saving rate averaged 4.5% in the third quarter of 2009, up from a low of 1.2% in the first quarter of 2008. The Federal Reserve reports that households lost over $11 trillion in household net worth from 2007 to the third quarter of 2009. Households have cut back on spending in order to replace this lost wealth.
Housing Market
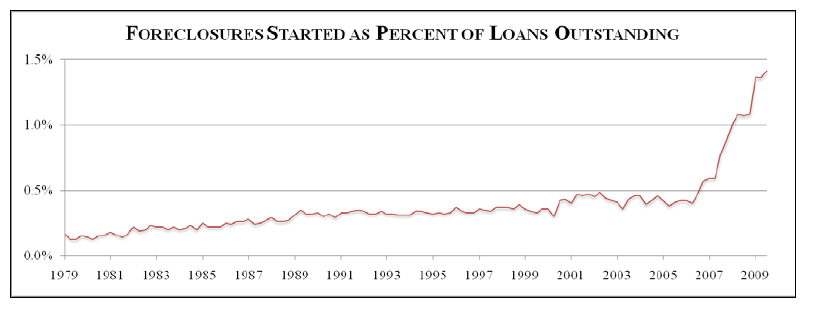
According to the Mortgage Bankers Association, foreclosure starts were at an all time record high of 1.42% in the third quarter of 2009, suggesting that foreclosure proceedings were initiated on over 750,000 homeowners between July and September. According to the Hope Now Alliance, roughly 2 million foreclosures have been completed since July 2007.
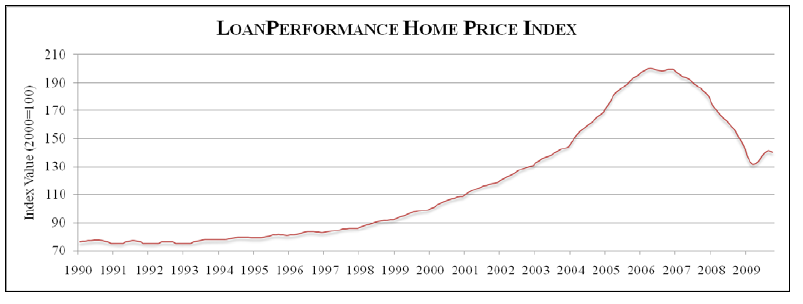
The First American CoreLogic LoanPerformance Home Price Index reflects a broad range of mortgages nationally. According to this index, home prices have fallen 30% from their peak in 2006. Notably, home prices have shown signs of stabilization in the recent data, according to this and other home price series.
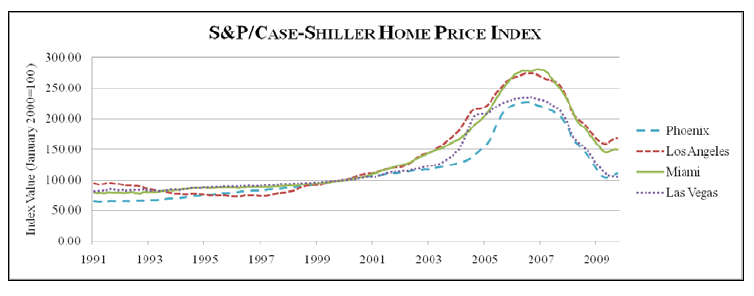
The S&P/Case-Shiller home price index reflects comprehensive house price data on 20 major cities back to the year 2000. Some markets experienced much greater price volatility than others. The graph above shows price movements in the “Sand States” (Arizona, California, Florida, and Nevada).
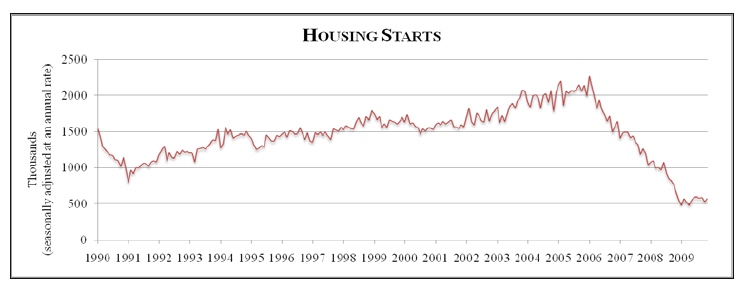
Housing starts have stabilized recently, but they are still down 75% from their recent peak in early 2006.
Federal Reserve purchases of longer-term Treasury and agency securities, including agency mortgage-backed securities, have helped to bring mortgage rates down to 5%–a historical low. The rate of refinancing has been strong but not as strong as it might be, at least in part reflecting households’ impaired credit.
Unemployment: Trending upwards
The December employment report showed that nonfarm payroll employment fell 85,000 since November. (In November, employment ticked up 4,000; November’s gain was the first increase since December 2007.) In addition, the unemployment rate remained at 10.0%. The unemployment rate was 4.9% in December of 2007. In December 2008, 15.3 million people were unemployed. By contrast, in December 2007, 7.7 million were unemployed. The recession has produced an extraordinary number of long-term unemployed: over 6 million people have been out of work for at least six months.
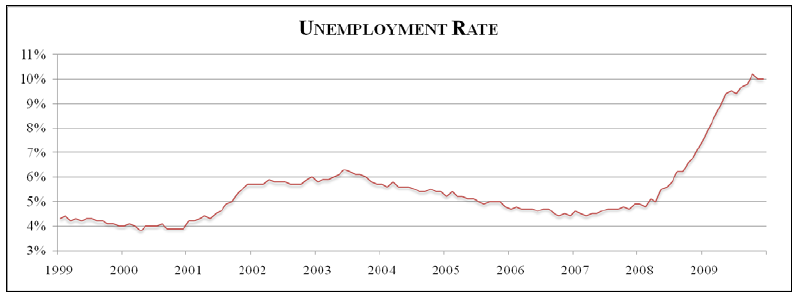
While the unemployment rate is 10.0%, the fraction of “underemployed” is much larger. The fraction of those unemployed, discouraged or otherwise not looking for work but willing to work, and those working part time for economic reasons was 17.3% last month.
Latest employment report from BLS:
“Temporary help services added 47,000 jobs in December. Since reaching a low point in July, temporary help services employment has risen by 166,000.” After a downturn, firms typically hire additional temporary workers before hiring additional permanent workers, in order to be sure that an economic recovery will be sustained. As a result, temporary hiring one closely watched indicator for signs of improvement in the labor market.
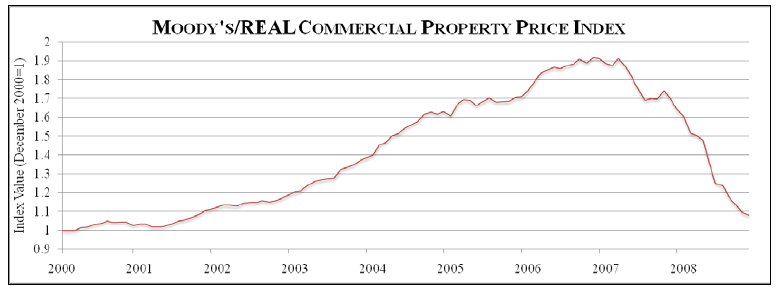
Moody Commercial Real Estate Price index
Construction of nonresidential properties fell in November for a seventh straight month, while spending on residential projects has shown some signs of life recently. Nonresidential construction is 10% below its level in April 2009, when it began declining. The Moody’s/REAL Commercial Property Price Index showed a 1.5% decline in prices in October. According to the data release, “The National All Property Type Aggregate Index now stands 36.4% below the level seen one year ago. The peak in prices was reached two years ago, in October 2007, and prices have since fallen 43.7%.”.
More optimistically, the Institute for Supply Management indicated that its index of new orders, a signal of future production, jumped last month to 65.5 from 60.3 in November, the highest level in five years. The index fell to a low of 32.9 in December 2008. In addition, the Federal Reserve index of industrial production has risen in four of the past five months, and business sentiment improved over the second half of 2009. Nonetheless, firms still have a significant amount of unused capacity, which will put downward pressure on business investment for some time to come.
Federal Reserve data show that bank loans fell at an annual rate of more than 11% in the third quarter of 2009, reflecting declines in all loan categories. In addition, the National Federation of Independent Business reports that loans remain difficult to get.
Sources: FDIC, FED New York, US Treasury, FCIC, Havel Analytics, GS, MS, Press Releases
Summary thoughts
The data presented was both exhaustive and quite indepth. But if we were to form an overall view on the US economy and state thereof, then I would say the contrarians have a case in point when they say there is a recovery underway albeit extremely weak. I would give the US economy 3/10 to actually emerge out of the recession without dipping back into deflation.
The key to US markets and economy has been its housing market which has served as a strong equity base on bank balance sheet.As long as the equity was increasing, there was no problem with the liabilities side of the balance sheet till 2006. The problem occured when the Equity (House price) started to crack in 2007. Soon the banks were flooded with an unbeleievable amount of writedowns and foreclosures. That housing market has fallen 30-75% (depending on which data you look at ranging from housing starts to House Price Index). What is amazing is that markets have forgotten about that. Or have they? What happened to those loans? They are now sitting on the FED balance sheet which has been bought from cash from the Treasury. But as we drilled down into the data from the housing market, we clearly see that there really is no improvement, which can be termed as significant. Foreclosures have reached 2 million houses counting from 2006.
House starts are still at the bottom (albeit shoeing some bounce but very small), house prices still declining YoY basis and House Net worth still well below even half way to 2007 levels. Unemployment is steadily rising at 10% and showing no signs of a downward trend and this will further push banking failures and asset price suppression.
But some parts of the economy are showing revival like the corporate profits from financial sector, ISM data which feeds from the manufacturing numbers and trade balances numbers. But none of these numbers have a strong bearing on core of the US economy and the american “dream”: The US Housing Industry.
Am inclined to support Bill Gross when he suggested that withdrawing the stimulus will be a mistake. US economy is at its most fragile and can break apart. Gross suggested that withdrawing the stimulus may be a mistake: Read about Gross Interview.
Gross later gave a more detailed analysis on why it will be a mistake. Read here: FED will exit in March
Given the numbers and analysis above, it is very difficult to argue with Bill Gross. But then Ben Bernanke might just be seeing things differently esp given the guy has to manage another 2.3 trillion of Bond auction this year.
Source: http://investingcontrarian.com/global/the-american-economy-introspect-and-mull/
Wish you a great trading and investing week ahead
God Bless.
Godly Abraham
http://investingcontrarian.com/
Formerly a hedge fund analyst for India's largest fund house and currently a Private Equity fund analyst with a swiss firm, Godly Abraham is an active writer at INVESTING CONTRARIAN which is a daily online publishing house, covering investing ideas and economic analysis on wide ranging topics but mainly specialized to covering US,UK, EU and BRIC countries and their political ramifications.
© 2010 Copyright Godly Abraham - All Rights Reserved
Disclaimer: The above is a matter of opinion provided for general information purposes only and is not intended as investment advice. Information and analysis above are derived from sources and utilising methods believed to be reliable, but we cannot accept responsibility for any losses you may incur as a result of this analysis. Individuals should consult with their personal financial advisors.
© 2005-2022 http://www.MarketOracle.co.uk - The Market Oracle is a FREE Daily Financial Markets Analysis & Forecasting online publication.


