


Stock Market Trend Technical Nuances
Stock-Markets / Stock Markets 2010 Jan 15, 2010 - 03:31 PM GMTBy: Brian_Bloom

 If reading the market was easy, we would all be rich. Arguably, there is more to investment decision making than computer algorithms. The human mind is extremely complex and human behaviour is extremely difficult (perhaps impossible?) to model. At the end of the day the economy is driven by the sum total of all businesses and investing is/should be about finding good companies which are well managed by professional managers who understand that they are employed by – and accountable to - shareholders.
That concept has been all but forgotten and managers are now effectively managing large corporations for their own personal benefit. Until that particular situation is rectified corporate profits will be doctored to suit management agendas. Therefore, sight should not be lost of the fact that, at the end of the day, it is not rising “profits” that creates wealth, it is rising cash flows.
The question investors need to ask themselves to determine whether the stock market is about to enter a new Primary Bull Trend is: “Are corporate cash flows going to keep rising across the entire economy?”
Below is a technical nuance to which it seemed important to draw readers’ attention (Chart courtesy BigCharts.com)
The first chart is an arithmetic chart of the Dow Jones dating back five years. Note how the price has broken “convincingly” above the falling trend line.

Now let’s look at the same chart on a semi logarithmic scale. This chart measures percentage price moves as opposed to purely arithmetic price moves.
Note how by joining the identical peaks to draw the “identical” falling trend line, the price has not yet convincingly penetrated the trend line on the upside.
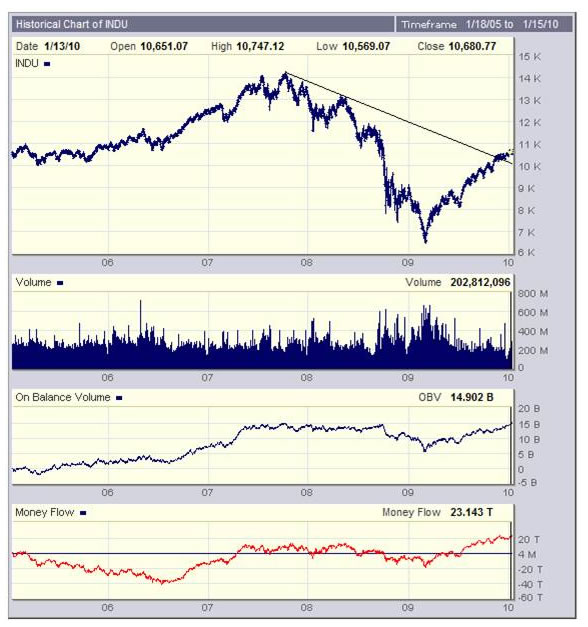
Now let’s look at the On Balance Volume chart and the Money flow chart. The OBV measures numbers of shares and the Money Flow measures value of shares.
Interestingly, money was flowing out of the market between 2005 and mid 2006 even as OBV was rising. (Professional Investors exiting but Small Investors still actively buying?)
Then the market rose to a new peak in 2007 as money flowed back into the market (Small investors getting carried away?)
Then prices fell sharply but volumes remained fairly flat, on balance, until late 2008. (Small Investors got caught in the headlights of the oncoming train and froze on the tracks? They stopped buying but hadn’t started selling yet?)
Then the Train Smash became inevitable! Note how money began to flow OUT of the market towards the end of the first half of 2008. (Professionals?)
Then, in about April/May 2009 both OBV and Money Flow bottomed and money began to flow back into the market. (TARP and other government intervention changed risk perceptions)
But here’s the thing: The On Balance Volume chart shows that all that has happened is that accumulated volume has reached the level that it started even as Money Flow has risen to new highs. Have institutions been getting back into the markets or has the rise in the share prices been caused by trading?
At face value, it is questionable whether institutions have been getting back in. Anecdotally, it would seem to this analyst that there are fewer funds investing in the markets today than there were in September 2008 because several have closed down or have less money under management. If this is true then the source of the buying in the past nine months has probably been Small Investors and large, sophisticated traders.
Conclusion
Arguably, small investors – desperate to claw back losses – have been sucked back into the market and are gambling that they will recoup these losses.
Overall Conclusion
You join the dots
By Brian Bloom
Once in a while a book comes along that ‘nails’ the issues of our times. Brian Bloom has demonstrated an uncanny ability to predict world events, sometimes even before they are on the media radar. First he predicted the world financial crisis and its timing, then the increasing controversies regarding the causes of climate change. Next will be a dawning understanding that humanity must embrace radically new thought paradigms with regard to energy, or face extinction.
Via the medium of its lighthearted and entertaining storyline, Beyond Neanderthal highlights the common links between Christianity, Judaism, Islam, Hinduism and Taoism and draws attention to an alternative energy source known to the Ancients. How was this common knowledge lost? Have ego and testosterone befuddled our thought processes? The Muslim population is now approaching 1.6 billion across the planet. The clash of civilizations between Judeo-Christians and Muslims is heightening. Is there a peaceful way to diffuse this situation or will ego and testosterone get in the way of that too? Beyond Neanderthal makes the case for a possible way forward on both the energy and the clash of civilizations fronts.
Copies of Beyond Neanderthal may be ordered via www.beyondneanderthal.com or from Amazon
Copyright © 2010 Brian Bloom - All Rights Reserved
Disclaimer: The above is a matter of opinion provided for general information purposes only and is not intended as investment advice. Information and analysis above are derived from sources and utilising methods believed to be reliable, but we cannot accept responsibility for any losses you may incur as a result of this analysis. Individuals should consult with their personal financial advisors.
Brian Bloom Archive |
© 2005-2022 http://www.MarketOracle.co.uk - The Market Oracle is a FREE Daily Financial Markets Analysis & Forecasting online publication.