


Watch Natural Gas in 2010
Commodities / Natural Gas Jan 14, 2010 - 12:46 AM GMTBy: Guy_Lerner

 If there is one commodity that I believe will be worth watching in 2010, it will be natural gas. Natural gas has the technical characteristics of an asset poised for a secular trend change from down to up, and I believe the price action over the past 4 months has already confirmed that a trend change is underway.
When we last visited natural gas, it was back on September 2, 2009. At the time, I stated the following:
"The close below three pivot low points is a pattern that I have identified that is consistently bearish across multiple markets and time frames (weekly and monthly price charts). On a monthly chart of natural gas, a monthly close below 3 pivot low points has never occurred before. August, 2009 resulted in a close below three pivot low points and a close below support levels as noted by the red trend line. The break down also occurred on a wide range price bar, which I would generally consider pretty conclusive. The most recent prior pivot point low is at $3.25, and with price currently at $2.37, I would consider that breakdown pretty significant."
"Of note, the all time lows occurred around $1.50 for natural gas."
For August, 2009, natural gas closed the month at $2.45. During September, natural gas reversed course after making an ultimate low at $1.92. It closed September at $3.38, which was above the prior pivot low at $3.25.
Fortunately, from that original article, I also wrote:
"I would not be a buyer of natural gas until there is a monthly close above the $3.25 level; what was support is now resistance."
As of today, natural gas is at $5.75.
Unfortunately, I lost site of natural gas in everything else that goes on around here, but this shouldn't detract from our present purpose and that is to identify an asset that has those secular tailwinds behind it. So why do I think natural gas has the potential for a prolong bullish run?
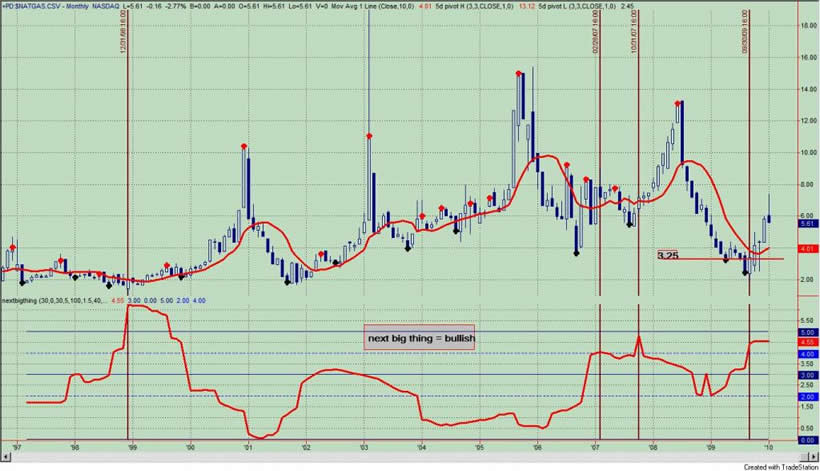
First and foremost is the price action, which is shown in figure 1 a monthly chart utilizing the cash data for natural gas. The spike down in August, 2009 (see down red arrows) was below support levels at $3.25. Old support becomes resistance, but the reversal (up green arrows) came a month later. This is bullish price action, especially within the context of the "next big thing" indicator being in a position that suggested that natural gas has the technical characteristics of an asset poised to undergo a secular trend change from down to up. See figure 2 a monthly chart with the "next big thing" indicator in the lower panel.
Figure 1. Natural Gas/ monthly
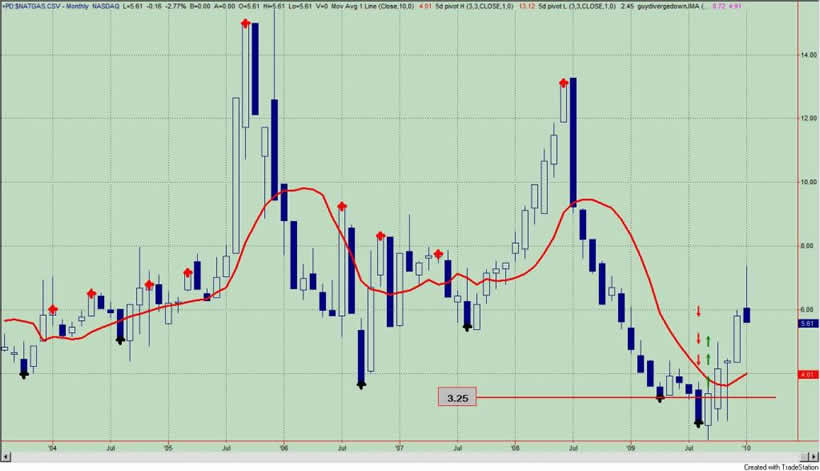
Figure 2. Natural Gas/ monthly
Let's take another look at the price action, but this time I will be using a weekly chart (see figure 3). In this instance, I will bring in our key pivot concept. Key pivot points are special pivot points as they are a pivot low point occurring at a time when investor sentiment is bearish (i.e, bull signal). Why are these key areas? Well think about it for a second. Sentiment gets extremes and prices should bounce higher and a pivot low point is formed on the chart. Typically, such price action will represent the low. However, failures do occur despite the extremes in sentiment, and prices can trade back below these key pivot points. It is these failures at the lows that lead to a reversal in the trend catching traders and investors off guard. For the sentiment data, I use the Market Vane bullish consensus for natural gas; this data is hidden on the chart.
Figure 3. Natural Gas/ weekly
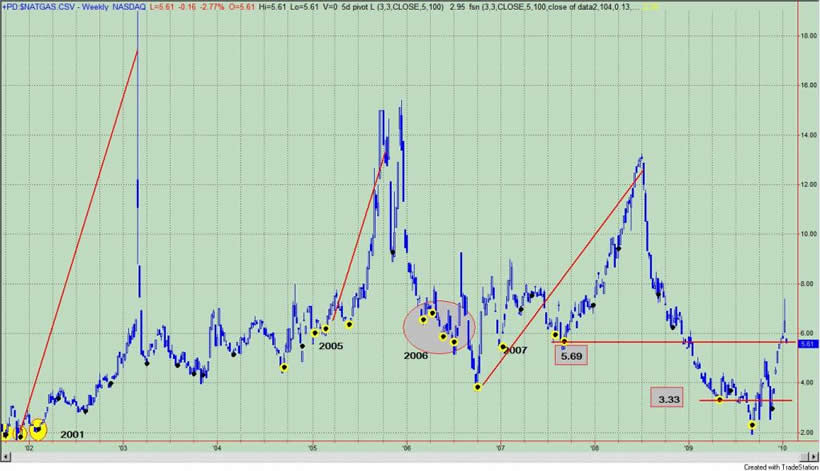
The key pivot points are identified by the yellow and black dots whereas our normal pivot points are just black. Several points regarding the price action are noteworthy: 1) a close below and then above the key pivot point at $3.33 is bullish; 2) a close above 3 key pivot points is very bullish and I have noted prior instances on the chart when this occurred. The lone failure of this pattern was in 2006 as noted by the gray oval. Of note and as always, I am basing my observations not only on natural gas but other asset classes as well. Closes above three pivot points - especially 3 key pivot points - is generally very bullish.
It should be noted that natural gas has closed above the third key pivot at $5.69. I suspect a pullback is in the offering for natural gas, and even it closes below the third key pivot, the price action has been bullish overall and it should remain so. In other words, dips should be bought.
Lastly, the question of how to "play" natural gas was brought up when we last visited this asset. Several readers had mentioned that the United States Natural Gas Fund (symbol: UNG) was a flawed product primarily because it relies upon futures contracts and the fund is prone to under performance especially if the market is in contango. In essence, UNG is poorly correlated with its underlying commodity, natural gas. Another way to "play" natural gas is to invest in the First Trust ISE Natural Gas ETF (symbol: FCG). This ETF seeks to replicate the ISE-Reserve Natural Gas Index. The fund invests at least 90% of assets in common stocks that comprise the index. For further reading on this topic, a good place to start is this recent article found on Seeking Alpha.
By Guy Lerner
http://thetechnicaltakedotcom.blogspot.com/
Guy M. Lerner, MD is the founder of ARL Advisers, LLC and managing partner of ARL Investment Partners, L.P. Dr. Lerner utilizes a research driven approach to determine those factors which lead to sustainable moves in the markets. He has developed many proprietary tools and trading models in his quest to outperform. Over the past four years, Lerner has shared his innovative approach with the readers of RealMoney.com and TheStreet.com as a featured columnist. He has been a regular guest on the Money Man Radio Show, DEX-TV, routinely published in the some of the most widely-read financial publications and has been a marquee speaker at financial seminars around the world.
© 2010 Copyright Guy Lerner - All Rights Reserved
Disclaimer: The above is a matter of opinion provided for general information purposes only and is not intended as investment advice. Information and analysis above are derived from sources and utilising methods believed to be reliable, but we cannot accept responsibility for any losses you may incur as a result of this analysis. Individuals should consult with their personal financial advisors.
Guy Lerner Archive |
© 2005-2022 http://www.MarketOracle.co.uk - The Market Oracle is a FREE Daily Financial Markets Analysis & Forecasting online publication.