


Stocks, Bonds, Gold, Silver and Forex Market Forecasts 2010
Stock-Markets / Financial Markets 2010 Jan 13, 2010 - 10:35 AM GMTBy: HRA_Advisory

 A year ago we said we believed a full court press by G10 central bankers, finance ministers and governments would succeed in at least halting the slide. It did, and markets responded more strongly than even we had hoped for, and we were among the more optimistic observers 12 months ago.
We also said a year ago that you were unlikely to see a repeat of 2008. It’s safe to say the same comment applies again. 2010 will not look like 2009.
Most markets experienced massive revision to the mean last year. That may be repeated again on a smaller scale, though this year that implies weaker gains for markets, not higher ones.
2010 will, hopefully, mark a transition to more normal economic conditions. That is positive, but it should also mean some upward movement on the interest rates and perhaps the US Dollar may have to be navigated.
Equity Markets:
At the start of 2009 we looked for gains for most markets, and emphasized the likelihood of the developing, creditor economies, and resources they need, to outperform. At the time, commodity prices were nearing their bottoms, though few could say how quickly they would recover. Seized-up credit markets had halted trade and many were seeing the onset of Depression in the numbers.
Markets had one more nasty down leg in them, and didn’t turn until the US Fed finalized it’s “too big too fail” list and started quantitative easing in a big way. Other central banks joined in the rate cuts, though the Bank of England was the only other to undertake QE officially.
The scale of the move off the bottom has many expecting the worst yet again. That’s an understandable viewpoint. The percentage moves off the ultimate bottoms have been very large by any standard.
The table below lists opening and closing levels and percentage changes for 2009 for several exchanges. Most exchanges suffered panic selling through February followed by an equivalent bounce in March. Using calendar year stats in effect cancels this out. That yields year/year gains that look a bit less hair-raising than the percentage moves off the absolute bailout bottom. This is arguably a more useful comparison; panic selling (and buying) can generate price changes that say as much about a given market’s liquidity as it does about underlying conditions.
The table lists results for major G7 and “BIC” countries plus the TSX Venture which is our proxy for the exploration sector. We italicized the results for the BIC indices and the TSXV though the highlighting isn’t necessary. The difference between the returns for these markets in 2009 and the “debtor country” indices is dramatic, to say the least.
Debtor country indices averaged a 21.4% return in 2009 while the BIC indices averaged 81.6%, fully 60% higher. We didn’t include Russia’s RTS index to create the more familiar “BRIC”, though that would have generated an even higher average.
Though less mature bourses are inherently more volatile, more it going on here. Part of the reason for the difference is that none of the BIC countries saw the level of panic selling the G7 markets did in Q1. India and Brazil had far milder declines and the bottom in Shanghai actually came in 2008. But the main reason for the difference is that these economies had either very mild recessions or none at all.
Also of note is the roughly 10% out performance by the indices in Toronto and Sidney. Canada and Australia (particularly the latter) have heavier commodity weighting and were sustained to a much greater degree by exports to China. Having banking sectors that were not totally dysfunctional didn’t hurt either.
As we expected, the highest percentage gain was enjoyed by the TSX-V. We thought a bounce from a 75% drop combined with good commodity prices should generate a large percentage lift. That gain only brings the Venture index to half of its 2007 level. There is plenty of repair work left. Gains have been and will remain selective for some time yet, and no one should be expecting a repeat of that move.
Equity Markets 2010:
We had been concerned about a revisit to the 2009 lows but those fears have dissipated, somewhat. The zero interest rate regimes brought a partial return of risk capital and the steepest yield curve in history is allowing banks to work on repairing their balance sheets.
No one should be complacent after a rally like the ones the markets experienced in the second half of 2009, but it doesn’t pay to underestimate the impact of zero rates and cost cutting either. The 2009 rally was not just about earnings expectations but about the interest rate used to discount them. Zero rates allowed for P/E expansion even though the “E” was actually pretty lame.
We expect earnings growth will be good for at least a couple of quarters going forward. Cost cutting, that reached panic levels across many sectors, and inventory replacement should generate impressive looking Y/Y earnings growth in Q4/2009 and Q1, and perhaps Q2. The bad news is that these gains will have come at the expense of unemployment. The happy Y/Y comparisons will dissipate as we get into H2 2010. Earnings and economic growth can continue later in 2010 only if economies begin to create jobs.
Employment growth may turn positive soon, but it will still be weak in most industrialized economies. Debt de-leveraging is far from complete and income growth will be needed to pay down debts for some time yet. We don’t see anything other than a large drop in the unemployment rate putting an end to residential and commercial foreclosures in the US.
All in all, we think its possible Debtor country indices can notch gains in the first bit of this year, but whether those gains hold or melt away later in the year will depend on the recovery broadening enough to attract re-investment.
Critical to this will be how the “sideline money” reacts through the first few months of 2010. While there is much concern about overly bullish sentiment in the markets, the money flows don’t seem to bear this out. Volumes on most major exchanges are extremely light. Even with a couple of large money market funds imploding in 2009 money parked in such funds is still near all time highs.
Investor surveys display bullish sentiment towards equities, but retail investors put fifty times as much new money into bond funds as they did into equity funds in 2009.
Clearly, many investors are still afraid of equities. It’s hard to say what, if anything will change this. A rally of close to 70% (from bottoms) hasn’t been convincing. A large pull-back may bring in bargain hunters but others may take it as proof they have been right to steer clear of equities.
Ironically, an increase in bond yields may drive some money back into equities. With rates at all time lows, odds are bond funds will perform poorly this year. Whether this generates new money flow into stocks at some point or investors simply abandon mutual funds of all types won’t be known until the worm turns.
If volumes do increase in the short term it will be partially due to some expected selling by those who did ride this rally. Funds that were smart or lucky enough to catch the bottom now have large gains to protect. That may cap near term gains. In short, while there may be more legs to the rally, it’s simply prudent to harvest profits occasionally and keep on your toes.
Even if the Y/Y change in the major indices is not large there will be plenty of volatility along the way, and continued light volumes will only enhance it. Note again that the comments about volume do not apply to the TSXV where trading volumes remained strong through 2009.
Currencies, Interest Rates and Gold:
These are all inter-related to some extent as can be seen from the charts below. One important take away from these charts is that the relationships between the US$, gold and Treasury yields have not been static. They have changed and even reversed a couple of times in the past two years, and are often different from how are sometimes perceived.
In particular, it’s worth remembering that gold in fact rose when the market was at its most panicked. The dollar held a strong inverse relationship to yields as money poured in to the Treasuries market during the panic. Those relationships appear to be starting to weaken and may potentially reverse. The USD and US bond yields have both strengthened in the past few weeks. This may be the bond vigilantes at work selling bonds on stronger US economic stats, which is a potential concern for 2010.
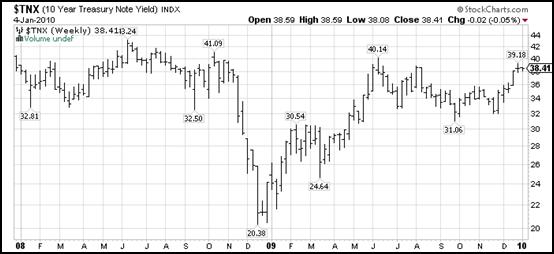
The US has to sell $2.4 Trillion in T-bills and notes in 2010 and has stated its intention to try and move farther out the yield curve. The US Government has been “borrowing short and spending long” for the past couple of years. This is exactly the pattern that got bankers in trouble so many times in the past. The question is whether bond buyers will agree to purchase enough longer dated treasuries this year at low yields.
We emphasize that we still see little or no chance of the Fed wanting to raise rates any time soon. The steep yield curve and near record low refinance rate are just too important to a fragile economy. The real question is whether bond traders do this in spite of efforts by the Fed to avoid it.
One question that will be answered in the first few months of 2010 is how much of the low rate environment is due to brute force buying by the Fed itself as part of its quantitative easing program. It’s certainly been a force in the market, but general caution and heavy inflows by private investors and other central banks are at least as big a factor.
We think yields are going up, especially if equities continue to do well, but probably not by more than a percent or so on the 10 year note. More than that, or any news that the bid to cover ratio on treasury auctions is weakening significantly (a ratio of 2 or higher, signaling a strong market, has twice as many bids than is needed to close the auction) should be taken as a danger sign and a signal for profit taking. If things get ugly, this could happen fast — better safe than sorry when it comes to the bond market this year.
As far as the $US itself goes, the much anticipated Dollar rally is upon us and not looking that impressive so far. The Euro and Yen have been gaining again as those regions released economic data less awful than feared. If US bond yields stay under control, the growing US Dollar float will continue to weigh on the greenback.
Many reasons have been given for a potentially large rally in the Dollar but they all boil down to the same thing: an assumption the Fed will be one of the first to raise rates. We see little reason for the Dollar to gain if the interest rate spread is not going to narrow in the near term. For all of the certainty about a big surge in the greenback we noted that large scale currency traders were pretty quick to close out their long positions as soon as the upward trajectory seemed to falter. There seems to be much less conviction about dollar gains in trading pits than on the financial pages.
If China slowed its bond purchases enough to send yields climbing in a big way, this might change. At this point Beijing still seems intent on holding the Dollar peg and is buying plenty of treasuries to recycle its current account surplus. Outside of the developing nations the problem with excessive debt is much the same across major currencies. It’s still a question of who will debase their currency faster, and the US still holds a clear lead on this.
Gold
After reaching all time highs and overbought status, gold pulled back in December. The price fell to $1080, well below the 40 day moving average that had acted as a base since the current up leg began in September. While a breech of this trend leaves open the possibility of a move down to the $1000 level that is not a necessity. The price has recently moved back above $1120 and appears to be stabilizing.
Although the pullback is not large, it seems to have served its purpose in quelling an overly bullish market. Some of gold’s new fair-weather friends made quick exits and even gold timing publications have swung from highly bullish to bearish in outlook. For a contrarian these are all bullish signs.
Most of the large funds that became gold proponents in the past few months appear to still be on board. Some additional support also came from an announcement by the Indian gold importers group that corrected the total 2009 Indian gold imports to “300-350” tonnes from a previously reported 200.
The gold price will fluctuate against the Dollar, but it is increasing held as a hedge against all currency defamation. Even if we think some of the romanticism about gold is overdone, its supply can’t be conjured out of thin air like fiat currencies. This simple fact has attracted quite a few converts to holding some bullion as a portfolio anchor. We expect continued strength and perhaps new highs in 2010 because of this. Importantly, at current prices gold mining can finally function well.
Other Precious Metals
Silver, platinum and palladium had much harder falls in 2008, but all have been gaining ground again lately. Unlike gold, none of these precious metals are anywhere near their 2007 highs and probably won’t be soon.
Recent percentage gains are strongest in platinum and palladium as industry and particularly the auto sector shows signs of life globally. Neither of these metals has large supply surpluses or ready sources of new cheap production. They should see more strength as the world economy continues to normalize.
Silver is the closest of the three to recent highs and has held up fairly well during this correction. We continue to consider above ground stocks a mystery, but new base metal operations have been slow to come on stream since last year which should help tighten the silver market.
Base Metals
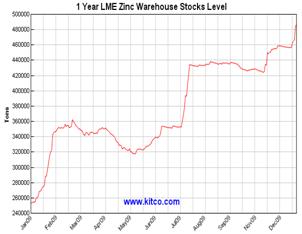
The one-year price and LME warehouse inventory charts on this page tell you everything you need to know about base metals, we’re just not sure exactly what that is.
As 2009 began we found ourselves about the only ones with anything good to say about base metals. Most of them had seen their prices crushed in 2008. Because we didn’t view them as being in bubble territory before the debt crisis, we also didn’t expect it to take long for them to bottom.
Much like the growth economies that drive them, base metals put in bottoms early in 2009 or in late 2008 in the case of copper. Most of them never looked back and have climbed steadily since.
Although base metals had seen large percentage price gains last year, most are still well off their highs. The moves are pretty impressive nonetheless given demand for most metals were below 2008 levels by a couple of percent or more.
Most metals saw relatively small increases in supply in 2009 but recessionary conditions were enough to keep warehouse inventories buildings after they based in Q1. This was the reason we got cautious in Q3 though our caution hasn’t been matched by others.
Notwithstanding almost constant increases in warehouse inventories for most base metals, prices have continued to rise. While we have only included LME warehouse and price charts for copper and zinc the picture is much the same for all of them.
Most base metals are at or near year highs and inventory build appeared to be accelerating at year end. We’ve said it before but we feel compelled to say it again: Some caution is required given the current strength of most base metal prices.
It may be that prices simply don’t fall much. There may be enough buyers looking out a few years and willing to hang onto excess metal in the meantime. That’s distinctly possible but still doesn’t explain the climbing warehouse inventories.
Skepticism about prices has been reflected in the share prices of base metal producers which have been flat for several months. The good news on the base metal side is that higher prices do seem to finally be helping companies farther down the food chain.
In recent weeks base metal explorers have been raising money again. Most are not doing it at prices they are happy about, but it’s still a vast improvement over the situation they faced earlier in the year. There has also been a marked increase in copper deals in the past month. Some of those may make it onto these pages later. Promoters have decided they can get attention for base metal deals again after avoiding them like the plague for 18 months.
Though we don’t expect dramatic drops in base metal prices we still think a period of price consolidation is needed. “Non traded” materials like coal and iron ore continue to fetch good prices and overall demand is solid.
This will not be a year like last year, but we think it will be another with gains for the taking. After a year of bubble talk by those who do not understand the mining sector there seems to be renewed acceptance that prices did not recover just because a couple of hedge funds stayed interested.
While we don’t expect large gains for the major markets, they are not required for the sector we deal with to do well. As long as major markets don’t hit the panic button again, metals explorers and developers will continue to be rewarded for discoveries.
As we expected, M&A activity continues to build across the sector. Not only that, but deals are getting done at very good prices. That generates free cash for new deals and sends traders off looking for the next likely candidate. Much of the recent market gains can be attributed to that sort of buying and we think it will continue. As long as the bankers don’t drop the ball again, the game is still on.
Ω
LATEST HRA OFFER: To access Eric Coffin’s latest interview and to sign up for our Latest FREE REPORT, including HRA’s most recent new company extended review and subscription savings, click here: http://www.hraadvisory.com/qa01.html
Gain access to potential gains of hundreds or even thousands of percent! From March to June, HRA introduced four new gold explorers to subscribers. Those four companies have generated an average gain of +205%, to date!
By David Coffin and Eric Coffin
http://www.hraadvisory.com
David Coffin and Eric Coffin are the editors of the HRA Journal, HRA Dispatch and HRA Special Delivery; a family of publications that are focused on metals exploration, development and production companies. Combined mining industry and market experience of over 50 years has made them among the most trusted independent analysts in the sector since they began publication of The Hard Rock Analyst in 1995. They were among the first to draw attention to the current commodities super cycle and the disastrous effects of massive forward gold hedging backed up by low grade mining in the 1990's. They have generated one of the best track records in the business thanks to decades of experience and contacts throughout the industry that help them get the story to their readers first. Please visit their website at www.hraadvisory.com for more information.
© 2009 Copyright HRA Advisory - All Rights Reserved
Disclaimer: The above is a matter of opinion provided for general information purposes only and is not intended as investment advice. Information and analysis above are derived from sources and utilising methods believed to be reliable, but we cannot accept responsibility for any losses you may incur as a result of this analysis. Individuals should consult with their personal financial advisors.
HRA Advisory Archive |
© 2005-2022 http://www.MarketOracle.co.uk - The Market Oracle is a FREE Daily Financial Markets Analysis & Forecasting online publication.