


Global Debt Deleveraging of Housing Market Bubbles, Why Reflation Will Fail
Economics / Global Debt Crisis Jan 12, 2010 - 11:45 AM GMTBy: Mike_Shedlock

 Inquiring minds are reading an interesting document by the San Francisco Fed called Global Household Leverage, House Prices, and Consumption.
"[O]ver-investment and over-speculation are often important; but they would have far less serious results were they not conducted with borrowed money." —Irving Fisher (1933)
In the United States and many other industrial countries, the recent financial crisis contributed to the longest and most severe economic contraction since the Great Depression. The rapid expansion in the use of borrowed money, or leverage, by households in recent years, is one factor that may help account for the virulence of the downturn.
In the years leading up to the crisis, a combination of factors, including low interest rates, lax lending standards, a proliferation of exotic mortgage products, and the growth of a global market for securitized loans fueled a rapid increase in household borrowing. An influx of new and often speculative homebuyers with access to easy credit helped bid up U.S. house prices to unprecedented levels relative to rents or disposable income. U.S. household leverage, as measured by the ratio of debt to personal disposable income, reached an all-time high, exceeding 130% in 2007 (see Glick and Lansing 2009). National house prices peaked in 2006 and have since dropped by about 30%. The bursting of the housing bubble set off a chain of events that pushed the U.S. economy into a severe recession that started in December 2007.
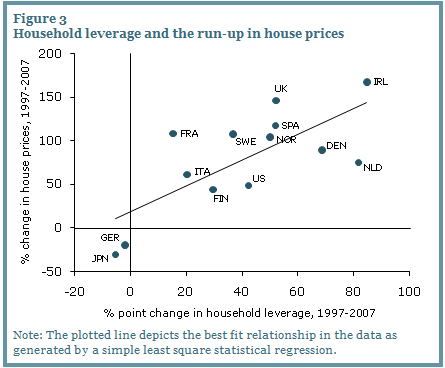
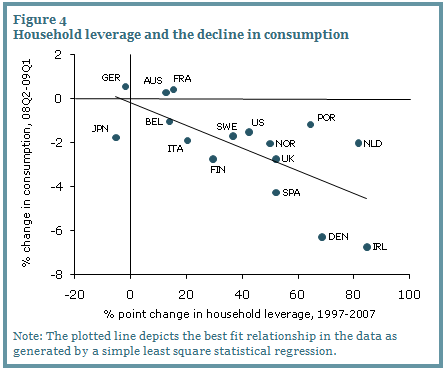
This Economic Letter shows that the recent U.S. experience is by no means unique. Household leverage in many industrial countries increased dramatically in the years prior to 2007. Countries with the largest increases in household leverage tended to experience the fastest rise in house prices over the same period. Moreover, these same countries tended to experience the most severe declines in consumption once house prices started falling. The common patterns observed across countries suggest that, as in the United States, the unwinding of excess household leverage via increased saving or increased default rates could be a significant drag on consumption and bank lending going forward, possibly muting the vigor of the economic recovery.
Household leverage and consumption: U.S. county data
The typical residential housing transaction is financed largely with borrowed money. The use of such leverage to purchase an asset magnifies the risk assumed by the buyer. If the value of the asset subsequently drops, as in a burst bubble, the debt incurred to buy the asset remains in place and the buyer must still repay the loan in full. If the debt exceeds the asset's market value, refinancing options are limited. If the debt is very large relative to the buyer's income, repayment can strain the buyer's finances, forcing a reduction in other spending. And if the strain becomes too great, the buyer may be forced to default, shifting some or all of the loss to the lender or the taxpayer if the loan is government-insured.
Using data on household borrowing for the 450 largest U.S. counties by population, Mian and Sufi (2009a,b) provide evidence that the rapid rise in household leverage in recent years was a primary driver of the recession that began in December 2007. Their analysis identifies several important patterns.
- First, they find that house prices rose faster in areas where subprime mortgages were more prevalent. This suggests the existence of a self-reinforcing feedback loop in which new buyers with access to easy mortgage credit helped fuel the run-up in prices by bidding competitively for houses, which in turn encouraged lenders to ease credit even further based on the assumption that house prices would continue to appreciate indefinitely.
- Second, the authors find that for each incremental dollar of house price appreciation, the average homeowner extracted about 25 to 30 cents in cash via home equity borrowing, which was used primarily for consumption or home improvement. This indicates that house price appreciation fueled by easy mortgage credit was a significant driver of economic growth during the boom years.
- Third, they find that counties that experienced the largest increases in leverage tended to experience the sharpest rise in loan defaults and the most severe recessions, where severity is measured by the subsequent fall in consumption of durable goods or the subsequent rise in the unemployment rate. The last point suggests that recession severity in a given area reflects the degree to which prior growth there was driven by an unsustainable borrowing trend--one which came to an abrupt halt once house prices stopped rising.
Household leverage and consumption: International data
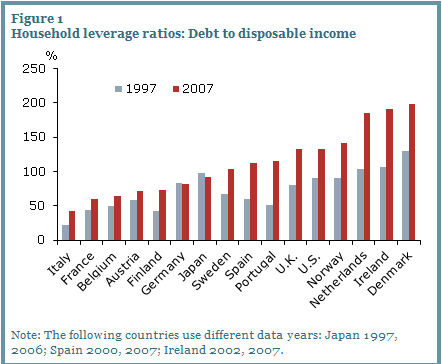
Figure 1 depicts the increase in the household leverage ratio, defined as household debt as a percent of disposable income including transfers, in the United States and 15 other industrial countries over a 10-year period ending in 2007, according to data from the Organisation for Economic Co-operation and Development.
Compared to the U.S. household leverage ratio of around 130% in 2007, leverage ratios were significantly higher in some countries, including Denmark (199%), Ireland (191%), and Netherlands (185%), but lower in others, such as Italy (43%), France (60%), Belgium (64%), and Germany (82%).
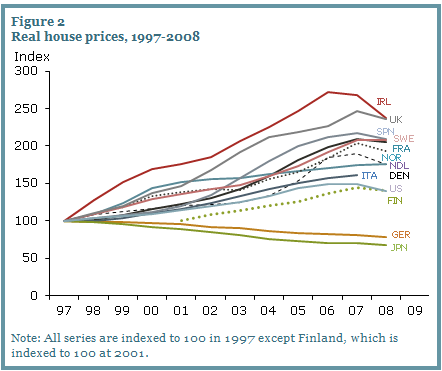
Figure 2 plots the trajectory of real house prices in the United States and other industrial countries since 1997. Austria, Belgium, and Portugal are omitted due to lack of data. Real house prices in the United States rose by roughly 50%, reaching a peak in 2006. House prices in other industrial countries also rose substantially and in most cases more than in the United States. At their peaks, prices rose the most in Ireland (172%), United Kingdom (146%), Spain (118%), and France and Sweden (108%), followed by Denmark, (89%), Netherlands (75%), and Italy (61%). These dramatic run-ups, which far exceeded the growth in disposable incomes over the same period, show that housing bubbles were widespread. The two exceptions were Japan and Germany, where real house prices fell over this period. However, both countries had previously experienced large run-ups in house prices during the late 1980s and early 1990s.
Household Leverage
Home Prices
Household Leverage vs. Home Prices
Household Leverage vs. Consumption
Conclusion
Going forward, the efforts of households in many countries to reduce their elevated debt loads via increased saving could result in sluggish recoveries of consumer spending. Higher saving rates and correspondingly lower rates of domestic consumption growth would mean that a larger share of GDP growth would need to come from business investment, net exports, or government spending. Debt reduction might also be accomplished via various forms of default, such as real estate short sales, foreclosures, and bankruptcies. But such deleveraging involves significant costs for consumers, including tax liabilities on forgiven debt, legal fees, and lower credit scores.
As countries begin to emerge from the recession, it is important to consider what lessons might be learned for the conduct of policy. History suggests that asset price bubbles can be extraordinarily costly when accompanied by significant increases in borrowing. During the recent housing bubble, underwriting standards were weakened and credit extension rose at abnormally high rates, creating a self-reinforcing feedback loop that drove house prices upward. In the aftermath of a global boom-and-bust cycle in credit and housing, financial regulators should take the necessary steps to prevent a replay of this damaging episode.
Bernanke In Denial
The first thing that comes to mind is the San Francisco Fed has it correct. Bernanke is in obvious denial as noted in Ben Bernanke Looks In Mirror, Sees Barney Frank.
Bernanke is pointing the finger at everyone but himself, primarily blaming regulation.
There is no possible regulation that can stop a credit binge brought about by cheap money and fractional reserve lending that enabled Fannie Mae and Freddie Mac to borrow money into existence at will, in conjunction with a Fed that could not even see there was a bubble, could not see there was a recession, and a Fed that thought at numerous points along the way that the mess was "contained".
Before Bernanke blamed regulation Bernanke Blames Saving Glut For Housing Bubble. Bear in mind it is absolutely impossible to have too much savings, but that is not the way Keynesian and monetarist clowns think.
Also bear in mind that "Two weeks into the job, Bernanke testified before Congress that it was a positive that the nation's homeownership rate had reached nearly 70 percent, in part because of subprime loans." (See Anatomy of a Meltdown for details).
Fed Is The "Great Enabler"
Credit bubbles have their foundation in loose monetary policy that makes borrowing appear attractive. Those bubbles may manifest in the form of stock market bubbles as in the Nasdaq in 1997-2000 or housing in 2004-2007. Indeed the Fed is the "Great Enabler" of bubbles.
Had by some miracle, regulation managed to contain housing (impossible actually because Bernanke could not see a bubble brewing and therefore would not have regulated a thing), the loose credit would simply have manifested itself in another way, just as happened in 2000 with the Nasdaq stock bubble.
The San Francisco article all but comes out and lays the blame on Bernanke. They won't say it but I will. Bernanke is a hopeless academic, trapped in a wonderland of formulas that have no bearing in the real world.
Bernanke should voluntarily step down in disgrace. If he refuses to do so, he should not be reappointed.
Finally, the Fed's (and central bankers in general) reflation efforts are doomed to fail because they bailed out the banks and left consumers still swamped in debt. Please see Fictional Reserve Lending And The Myth Of Excess Reserves for a complete discussion.
Having learned their lesson at taxpayer expense, and fearing they will not be bailed out next time, banks won't lend. Moreover, the bailout policies of the Fed and Congress ensure that banks will not lend as there are few credit worthy borrowers, and even fewer credit worthy borrowers who want to expand businesses.
Not only did the Fed enable the credit bubble, it blew the policy response. All it takes to prove that is another stock market plunge and credit crunch. Both are coming, we just don't know when.
By Mike "Mish" Shedlock
http://globaleconomicanalysis.blogspot.com
Click Here To Scroll Thru My Recent Post List
Mike Shedlock / Mish is a registered investment advisor representative for SitkaPacific Capital Management . Sitka Pacific is an asset management firm whose goal is strong performance and low volatility, regardless of market direction.
Visit Sitka Pacific's Account Management Page to learn more about wealth management and capital preservation strategies of Sitka Pacific.
I do weekly podcasts every Thursday on HoweStreet and a brief 7 minute segment on Saturday on CKNW AM 980 in Vancouver.
When not writing about stocks or the economy I spends a great deal of time on photography and in the garden. I have over 80 magazine and book cover credits. Some of my Wisconsin and gardening images can be seen at MichaelShedlock.com .
© 2010 Mike Shedlock, All Rights Reserved
Mike Shedlock Archive |
© 2005-2022 http://www.MarketOracle.co.uk - The Market Oracle is a FREE Daily Financial Markets Analysis & Forecasting online publication.