


Wealth Effect or Borrowing / Asset Sales Effect?
Economics / US Economy Jul 25, 2007 - 10:00 PM GMTBy: Paul_L_Kasriel
 In the question-and-answer session following his semiannual monetary policy report to Congress last week, Fed Chairman Ben Bernanke pooh-poohed the notion that mortgage equity withdrawal (MEW) had played much of a role in funding household spending in recent years. Rather, Chairman Bernanke, like most academics, cited the "wealth effect" as responsible for stimulating household spending.
The wealth effect refers to the phenomenon that as household net worth increases, household spending relative to income increases. In other words, if the value of my stock portfolio rises today, I dine out at Applebee's tonight rather than McDonald's. Although the wealth effect might be appealing theoretically to academics, it does not stand up to logic if households are incurring outright deficits. If households are running deficits - i.e., they are spending more than their income - they either must be borrowing, and perhaps posting their wealth as collateral, or selling assets to non-household entities. MEW, of course, would fall into the borrowing category.
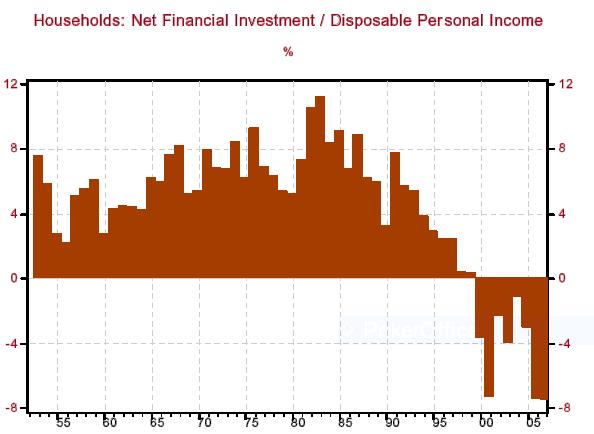
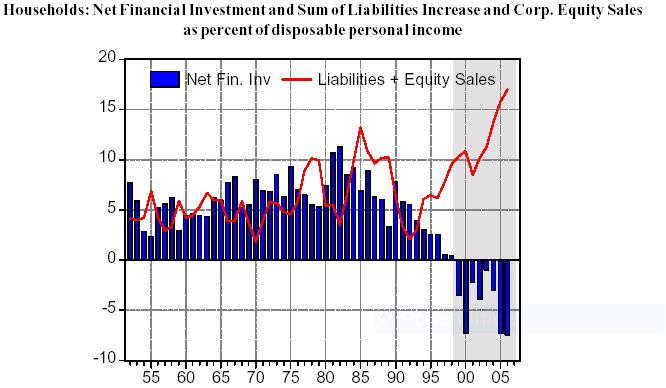
It certainly is true that in the past 10 years households have experienced unusually large absolute and relative capital appreciation on the assets they hold (see Chart 1). But at the same time, their total spending relative to income increased to the point that they were actually running deficits. This is shown in Chart 2, which plots household net financial investment as a percent of disposable personal income. Net financial investment is households' net acquisition of financial assets (stocks, bonds, mutual funds, deposits, claims on pension and insurance reserves) minus the net increase in households' liabilities.
In my May 30 Econtrarian ( Gene Epstein's Great American Savings (sic) Myth ) I demonstrate algebraically how negative net financial investment implies that households are spending in excess of their income. Chart 2 shows that households began running deficits in 1999. Households were getting wealthier in the late 1990s because of extraordinary holding gains on assets, but if they were increasing their spending above their after-tax income, they had to be funding their deficits by borrowing and/or selling assets. Any alleged wealth effects cease to be operable once household deficit spending sets in.
Chart 1
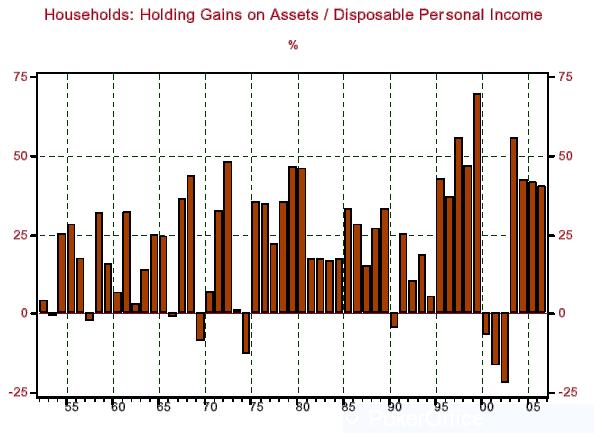
Chart 2
What is the evidence on household borrowing and asset sales to non-household entities in recent years? The Federal Reserve's flow-of-funds data hold the answers. Let's start with asset sales. Chart 3 shows the annual net issuance of corporate equities and the annual purchase of U.S. equities by the rest of the world. If the net purchase of U.S. corporate equities by the rest of the world is greater than the net issuance of corporate equities, then U.S. households, by definition, must be net sellers of corporate equities. As an aside, net corporate equity issuance in 2005 was minus $415.2 billion.
What accounts for a net "retirement" of corporate equities? Corporate stock buybacks and listed companies being taken private. In 2005, corporations stepped up their borrowing to help fund stock buybacks. Private equity transactions used to be called leveraged buyouts. Thus, increased borrowing by corporations and private equity syndicates plays a large role in the retirement of corporate equities. Rather than households borrowing directly to fund their deficits, the purchasers of household assets are doing the borrowing.
Chart 3
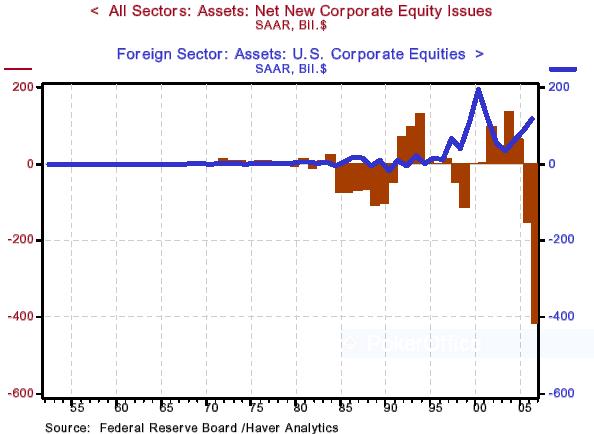
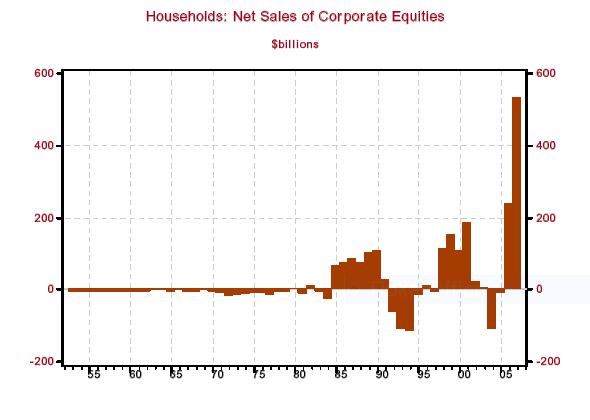
Chart 4 shows U.S. households' net sales of corporate equities. Starting in 1984, U.S. households were more often net sellers of corporate equities. In only two years - 2003 and 2004 - in the 10 years ended 2006 were U.S. households net purchasers of corporate equities. So, in recent years, as households have been running deficits, they have usually been net sellers of corporate equities, which has helped fund their deficits. As mentioned above, some of the equities being purchased from households are funded through increased borrowing on the part of the purchasers.
Chart 4
Household borrowing is straightforward. Chart 5 shows that the increase in household liabilities reached a record 13.7% of disposable personal income in 2004. Chart 6 shows a subset of household borrowing, MEW, and household net financial investment. Is it a coincidence that MEW picked up as households began running deficits?
Chart 5
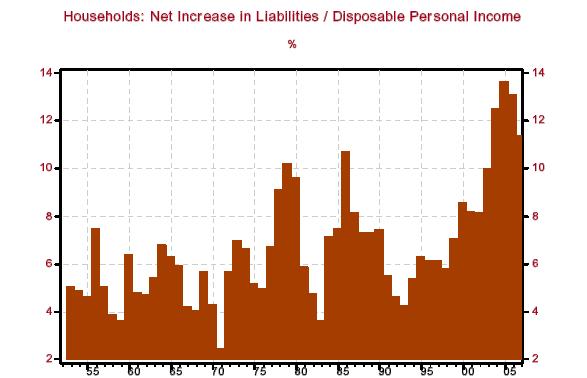
Chart 6
In Chart 7, I have combined households' net increases in liabilities and their net sales of corporate equities, scaling this sum against disposable personal income. As households began running deficits in 1999, their borrowing and sales of assets - corporate equities - increased in order to fund their deficits. In 2006, households' combined borrowing and corporate equities sales reached a record high 17.0% of disposable personal income.
Chart 7
Let's pause for a review. If households are running a deficit, then they have to fund that deficit by either borrowing and/or selling assets. Households began running deficits in 1999. At that time, their combined borrowing and sales of corporate equities began increasing.
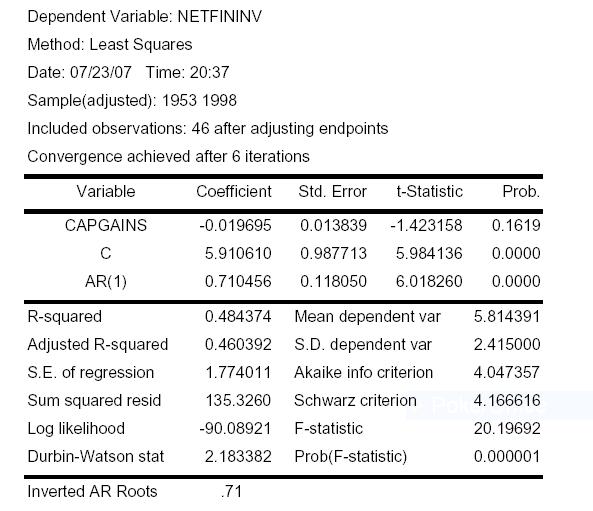
Now, let's estimate a simple wealth-effect relationship and see how well it forecasts when households run deficits. The wealth effect hypothesizes that increases in holding gains on household assets ought to be positively related to household spending relative to income. I ran an ordinary least-squares recession with household net financial investment as a percent of disposable personal income (NETFININV) as the dependent variable, holding gains on assets as a percent of disposable personal income (CAPGAINS) as the independent variable, and a constant term (C). Because the original regression results indicated the presence of serial correlation, I added a first-order autoregressive term, AR(1), to adjust for the serial correlation. I estimated this relationship over the interval 1953 through 1998. The results of this regression are shown below. Although the expected negative sign on the holding-gains coefficient was obtained - i.e., an increase in relative holding gains is associated with a decrease in relative net financial investment, which means relative household spending is rising -- its t-statistic was relatively low, suggesting only a tenuous wealth-effect relationship.
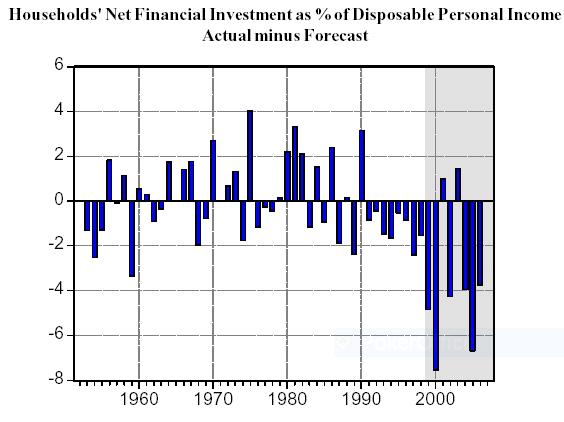
I then used this estimated relationship to forecast household net financial investment as a percent of disposable personal income. Chart 8 shows the difference between the actual household net financial investment and the forecast values. The shaded area, 1999 through 2006, is a period outside the interval used to estimate the relationship and is the period when households began running deficits. In six of the eight years ended 2006, the model forecasted relative household net financial investment to be higher than actual (i.e., readings below zero) - substantially higher. This suggests that whatever weak wealth-effect relationship might have prevailed from 1953 through 1998 deteriorated starting in 1999.
Chart 8
Households' Net Financial Investment as % of Disposable Personal Income
Actual minus Forecast
But this is exactly what should have occurred with regard to wealth effect. To repeat, if households are spending more than they are earning, they must fund their deficit either through borrowing and/or asset sales, neither of which is a wealth effect. To deny that MEW has played a role in funding household spending when households have been running deficits flies in the face of logic and data. Chairman Bernanke is whistling past the graveyard if he thinks that the housing recession is not going to negatively affect consumer spending via declining MEW.
*Paul Kasriel is the recipient of the 2006 Lawrence R. Klein Award for Blue Chip Forecasting Accuracy
By Paul L. Kasriel
The Northern Trust Company
Economic Research Department - Daily Global Commentary
Copyright © 2007 Paul Kasriel
Paul joined the economic research unit of The Northern Trust Company in 1986 as Vice President and Economist, being named Senior Vice President and Director of Economic Research in 2000. His economic and interest rate forecasts are used both internally and by clients. The accuracy of the Economic Research Department's forecasts has consistently been highly-ranked in the Blue Chip survey of about 50 forecasters over the years. To that point, Paul received the prestigious 2006 Lawrence R. Klein Award for having the most accurate economic forecast among the Blue Chip survey participants for the years 2002 through 2005.
The opinions expressed herein are those of the author and do not necessarily represent the views of The Northern Trust Company. The Northern Trust Company does not warrant the accuracy or completeness of information contained herein, such information is subject to change and is not intended to influence your investment decisions.
Paul L. Kasriel Archive |
© 2005-2022 http://www.MarketOracle.co.uk - The Market Oracle is a FREE Daily Financial Markets Analysis & Forecasting online publication.