


Stock Market Indices Shrug Off Payrolls and Push to New Highs
Stock-Markets / Financial Markets 2010 Jan 10, 2010 - 06:22 AM GMT

 Back from the festive season break, traders pushed stock market indices to new highs for the rally, logging a full house of five up-days for the S&P 500 Index and pushing the CBOE Volatility (VIX) Index - also referred to as the “fear gauge” of the US stock markets - down to levels last seen pre-Lehman in 2008.
Pundits shrugged off Friday’s unexpected decline in non-farm payrolls, as well as mixed economic data earlier in the week, focusing instead on the Federal Open Market Committee’s (FOMC) communiqué for its December 15-16 meeting which maintained its “extended period” stance for easy monetary policy, i.e. more “juice” for risky assets.
Asha Bangalore (Northern Trust) said: “The details and tone of the December employment report indicate that labor market conditions remain bothersome. A meaningful pace of hiring is unlikely in the next few months given the structural unemployment in the economy, the shortened workweek, and the large number of part-time workers. In other words, the December employment report reinforces expectations of the FOMC on hold in the near term. The Fed is unlikely to undertake a reduction of monetary accommodation until the unemployment rate has peaked.”
Source: Walt Handelsman
The past week’s performance of the major asset classes is summarized by the chart below - a set of numbers that indicates renewed investor appetite for risky assets. Silver (+9.5%), “the poor man’s gold”, and platinum (+7.0%) were the stars of the week, playing catch-up on historically cheap ratios relative to gold bullion. The yellow metal (+3.7%) also resumed its uptrend with a so-called “upward price dynamic” on Monday. Bonds performed poorly as Pimco and BlackRock, among others, cut holdings of US and UK debt as the two nations’ borrowings hit record levels.
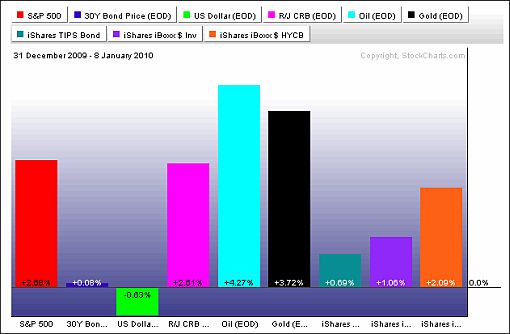
Source: StockCharts.com
A summary of the movements of major global stock markets for the past week and various other measurement periods is given in the table below.
The MSCI World Index (+2.5%) and the MSCI Emerging Markets Index (+2.7%) experienced a strong first week of 2010. Only three emerging markets - the Shanghai Composite Index (-2.5%), the Russian Trading System Index (-0.4%) and the Venezuela Caracas General Index (-1.2%) - bucked the broader uptrend.
Notwithstanding solid gains since the March lows, only the Chile Stock Market General Index, one of the week’s strongest performers, has been able to reclaim its 2007 pre-crisis peak - now trading 6.5% higher. Mexico and Brazil could be the next countries to eliminate the bear market losses.
As far as the US indices are concerned, Wall Street managed to hit 15-month highs on Friday. This means that the S&P 500 Index and the Dow Jones Industrial Index have now retraced 55% and 54% respectively of their crisis losses. After the thin festive season period, volume on the NYSE came close to the one-year average.
Nine of the ten economic sectors (as measured by the SPDR exchange-traded funds [ETFs]) closed higher for the week, with the cyclical sectors in general outperforming the defensive sectors. Materials (+5.9%), Energy (+5.8%), Financials (+5.7%) and Industrials (+5.3%) all returned handsome gains, whereas Utilities (-1.0%) was the only sector in the red.
Click here or on the table below for a larger image.
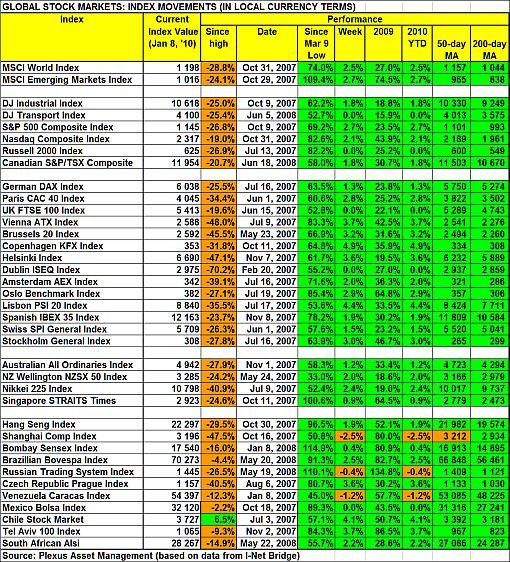
Top performers among stock markets this week were Latvia (+13.2%), Peru (+12.3%), Luxembourg (+6.1%), Greece (+6.0%) and Cyprus (+5.4%). At the bottom end of the performance rankings, countries included Slovakia (-14.1%), Bermuda (-2.5%), China (-2.5%), Nepal (-2.2%) and Venezuela (-1.2%).
The declines in the Shanghai Composite Index came in the wake of investors’ concerns about a flood of initial public stock offerings (IPOs) and the authorities’ actions to slow down lending. Of all the major indices, the Shanghai Composite is the only one trading marginally below its 50-day moving average. Also, as shown by the declining green line in the bottom portion of the chart below, Chinese stocks have since July been underperforming the S&P 500 Index - a reversal of roles since China turned the bear market corner five months before most other markets in November 2008. Interestingly, Marc Faber told CNBC (via MoneyNews): “My feeling is that the US will outperform emerging economies in the first six months of 2010.”
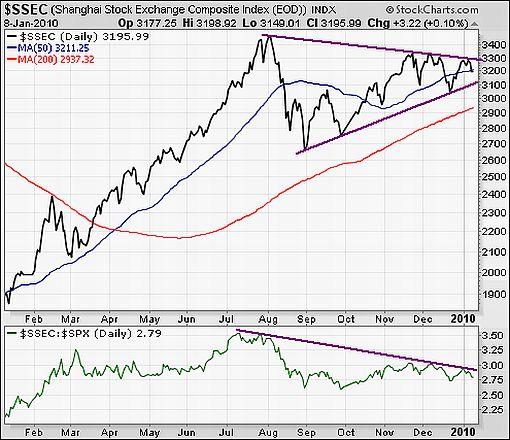
Source: StockCharts.com
Of the 96 stock markets I keep on my radar screen, 79% recorded gains, 15% showed losses and 6% remained unchanged. The performance map below tells the past week’s rather bullish story.
Emerginvest world markets heat map
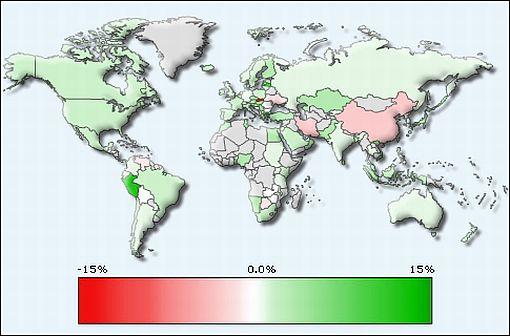
Source: Emerginvest (Click here to access a complete list of global stock market movements.)
John Nyaradi (Wall Street Sector Selector) reports that, as far as ETFs are concerned, the winners for the week included SPDR S&P Metals & Mining (XME) (+13.8%), Claymore/Delta Global Shipping (SEA) (+12.3%) and Market Vectors Coal (KOL) (+11.4%).
At the bottom end of the performance rankings, ETFs included ProShares Short Oil and Gas (DDG) (-4.6%), HOLDRS Merrill Lynch Telecom (TTH) (-3.1%) and Vanguard Extended Duration Treasury (EDV) (-2.9%).
Referring to the issue of financial reforms, the quote du jour this week comes from Nobel economist Joseph Stiglitz. He recently warned (via MarketWatch): “Unless Wall Street’s incentive system is drastically reformed, ‘the financial sector will only try to circumvent whatever new regulations we put in place. We will simply have a short respite before the next crisis.’ Warning: nothing’s changed, it’s worse: Lobbyists run Obama, Congress and the Fed.”
To this, former IMF chief economist Simon Johnson added (according to MarketWatch): “Yes, ‘we’re running out of time … to prevent a true depression’. The ‘financial industry has effectively captured our government’ and is ‘blocking essential reform’, and unless we break Wall Street’s ’stranglehold’ we will be unable prevent the Great Depression 2.”
On a related note, The Wall Street Journal reports that the Financial Crisis Inquiry Commission, formed by Congress in 2009 to investigate the causes of the economic turmoil, will have public hearings on Wednesday and Thursday in Washington with top Wall Street bankers.
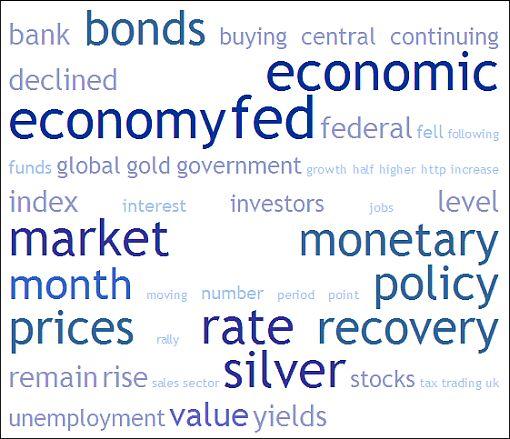
Next, a quick textual analysis of my week’s reading. This is a way of visualizing word frequencies at a glance. The usual economic terms (”economy”, Fed”, “rate”, etc.) feature prominently, but “bonds” and “silver” also mustered some attention. Will we perhaps look back at these assets a year from now and see one of the worst and one of the top performers respectively for 2010? A long silver, short Treasuries trade makes perfect sense to me.
Back to the stock markets: The major moving-average levels for the benchmark US indices, the BRIC countries and South Africa (where I am based in Cape Town) are given in the table below. With the exception of the Shanghai Composite Index (discussed above), the indices in the table are all trading above their 50-day moving averages, with all the indices also comfortably above their respective key 200-day moving averages.
As far as the S&P 500 Index is concerned, the next upside target will be at the upper end of its upwardly sloping price channel at 1,250. A break below the lower level of the channel at 1,085 (and the December low of 1,092) could signal a deeper pullback.
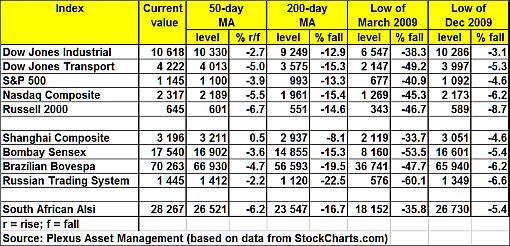
Click here or on the table below for a larger image.
“Anecdotally investors remain very skeptical of the continued advance which suggests the ‘wall of worry’ is still in place,” said Kevin Lane of Fusion IQ.
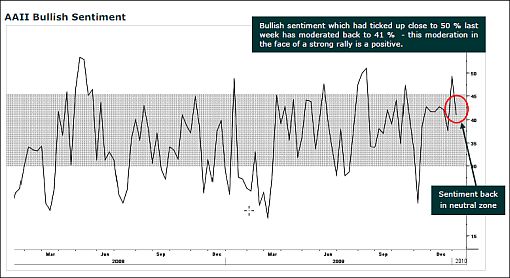
Source: Fusion IQ, January 7, 2010.
Casting his eye on 2010, David Fuller (Fullermoney) said: “Stock market action continues to confirm a bull market in every respect. Downside risk is probably limited to periodic mean reversions towards the rising 200-day moving averages.
“The main danger signs to look for will be an eventual, persistent tightening of monetary policy and an inverted yield curve. When this next happens, and both tend to be lead indicators, I will focus on introducing trailing stops for all equity positions, actual or mental, and ideally use strength to reduce equity exposure. Currently, I maintain that we are still in the second psychological perception stage of the bull market, characterized by the ‘wall of worry’. With any luck, we can look forward to the third and climactic stage of a bull market cycle, in which investors become euphoric.
“The time to start thinking about closing long portfolios in anticipation of the next bear market, I suggest, will be when the yield curve (US 10-year yields over 2-year yields) next inverts by moving below zero. However, the lead was so early last time (early 2006) that some of us became complacent about it.”
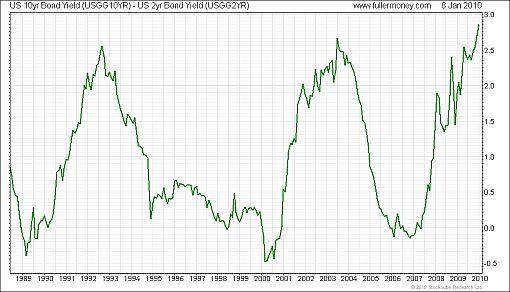
Source: Fullermoney
While on the topic of long-term charts, when considering S&P 500 monthly data, three momentum-type oscillators (RSI, MACD and ROC) all still signal a bullish trend. (As an aside, the long-term picture for US government bonds is in bearish mode as highlighted in a post a few days ago.)
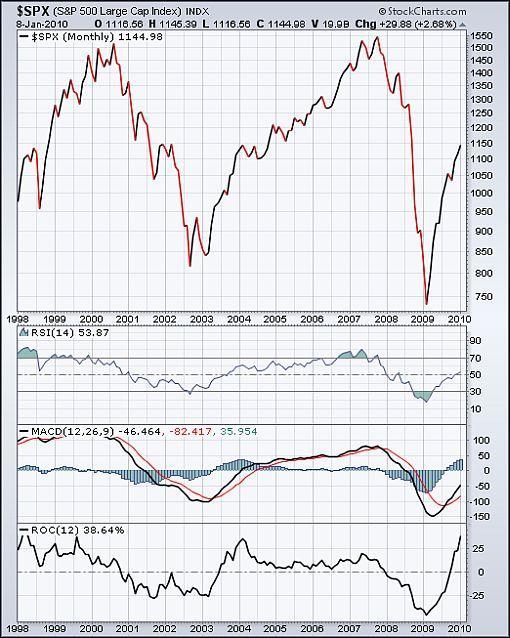
Source: StockCharts.com
“Where breadth goes, the market usually follows,” goes an old market saw. Analyzing market internals, the number of NYSE stocks trading above their respective 50-day moving averages has increased to 86% from 30% in October (see chart below). “The fact that breadth has caught up with the new highs in the overall market is a good thing for the health of the bull market. If it gets up near 90%, however, there won’t be much more room for upside in the short term,” remarked Bespoke. For a primary uptrend to be in place, the bulk of the index constituents also need to trade above their 200-day averages. The number at the moment is 89% - somewhat down from its September peak of 93%, but nevertheless firmly in bullish terrain.
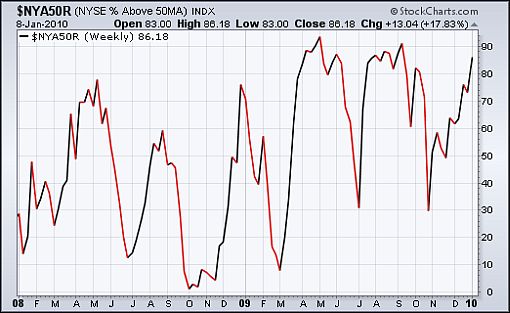
Source: StockCharts.com
Not everybody shares Fuller’s optimism. Having pinpointed the bottom in March, GMO’s Jeremy Grantham now warns that our irrational nightmare will repeat. “A year ago we came dangerously close to the Great Depression 2. Unfortunately, we’ve learned nothing … condemning ourselves to another serious financial crisis in the not-too-distant future,” he is quoted by MarketWatch. “We had our bear-market rally. Next, historical cycles plus our irrational behavior guarantees another, bigger global meltdown. We learned nothing.”
It goes without saying that the strong rally since March is bound to be followed by a correction at some stage. But rather than pre-empting (and more often than not getting it wrong as a result of short-term noise), I will be guided by the longer-term charts and the yield curve to identify a major top. Meanwhile, I am watching valuations carefully, and specifically how the Q4 earnings reports stack up. Although I am treading with caution after the 74% rally in the mature markets and 109% in emerging markets, I am not ignoring good old stock-picking, and specifically those companies with strong balance sheets that will be growing their dividends over time with a reasonable degree of certainty.
Twitter and Facebook
I regularly post short comments (maximum 140 characters) on topical economic and market issues, web links and graphs on Twitter. For those readers not doing so already, you can follow my “tweets” by clicking here. You may also consider joining me as a friend on Facebook.
Economy
The Recession Status Map below, courtesy of Dismal Scientist Economy.com, aggregates growth statistics from around the world and allows one to see at a glance which economies are in recession, at risk, recovering or expanding. Click on the map to link to the interactive version.
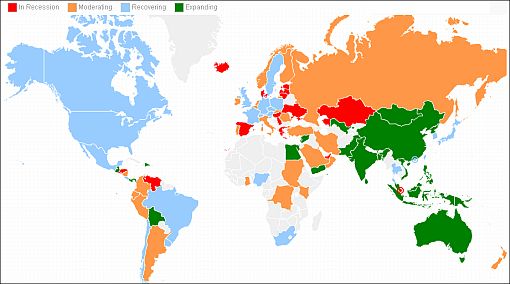
Source: Dismal Scientist
“Business sentiment around the globe remains about where it has been since last summer - consistent with a tentative global economic recovery. Businesses are most upbeat when responding to broad questions about current conditions and expectations through the middle of this year. However, they remain cautious when responding to specific questions about sales, pricing, inventories and hiring,” according to the results of the latest Survey of Business Confidence of the World by Moody’s Economy.com. Importantly, the survey results suggest that the global recovery is holding its own, but provide no indication that the recovery is gaining significant traction.
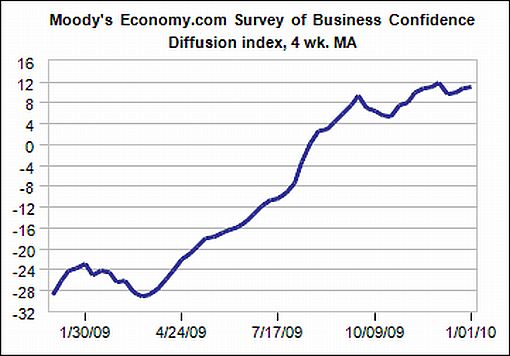
Source: Moody’s Economy.com
Released on Monday, purchasing managers’ surveys for December exceeded expectations from China to Europe and the US, reported the Financial Times. “Across the world, the combined scores of national purchasing managers’ indices, compiled by JP Morgan, rose to 55 in December, the highest since April 2006, with the index for new orders at a 5½ year high.”
The global economic rebound is likely to be even stronger than many have anticipated and developed markets have the potential to outperform emerging markets, Jim O’Neill, head of global economic research at Goldman Sachs, told CNBC. “I think what we’ve seen since the turn of the year … is actually really strong,” he said.
Goldman Sachs analysts estimate that the world economic growth will be 4.4% this year and 4.5% in 2011.
The article continues here
By Dr Prieur du Plessis
Dr Prieur du Plessis is an investment professional with 25 years' experience in investment research and portfolio management.
More than 1200 of his articles on investment-related topics have been published in various regular newspaper, journal and Internet columns (including his blog, Investment Postcards from Cape Town : www.investmentpostcards.com ). He has also published a book, Financial Basics: Investment.
Prieur is chairman and principal shareholder of South African-based Plexus Asset Management , which he founded in 1995. The group conducts investment management, investment consulting, private equity and real estate activities in South Africa and other African countries.
Plexus is the South African partner of John Mauldin , Dallas-based author of the popular Thoughts from the Frontline newsletter, and also has an exclusive licensing agreement with California-based Research Affiliates for managing and distributing its enhanced Fundamental Index™ methodology in the Pan-African area.
Prieur is 53 years old and live with his wife, television producer and presenter Isabel Verwey, and two children in Cape Town , South Africa . His leisure activities include long-distance running, traveling, reading and motor-cycling.
Copyright © 2010 by Prieur du Plessis - All rights reserved.
Disclaimer: The above is a matter of opinion and is not intended as investment advice. Information and analysis above are derived from sources and utilizing methods believed reliable, but we cannot accept responsibility for any trading losses you may incur as a result of this analysis. Do your own due diligence.
Prieur du Plessis Archive |
© 2005-2022 http://www.MarketOracle.co.uk - The Market Oracle is a FREE Daily Financial Markets Analysis & Forecasting online publication.