


Massive 43% Jump in U.S. Emergency Unemployment Benefits, Government Manipulating Data?
Economics / Economic Statistics Jan 08, 2010 - 02:00 AM GMTBy: Mike_Shedlock

 I was intrigued by a post by Zero Hedge asking Is The Government Misrepresenting Unemployment By 32%?
"...government spent a record $14.7 billion on Unemployment Insurance Benefits as of December 30, a 24% jump sequentially from the $11.8 billion in November. Yet the DOL has disclosed a mere 1.7% increase in those to whom insurance benefits are paid: from 9.4 million to just under 9.6 million. To put the $14.7 billion number in perspective, in December the Federal Government paid a total of $14 billion ($700 million less) in Federal Salaries!
And some more perspective: in calendar 2009 the government has paid $140 billion in Unemployment Insurance Benefits. This is yet another economic stimulus that nobody in the administration discusses, yet which undoubtedly has the biggest impact on the economy, as all those millions unemployed can moderate their pain courtesy of a passable weekly check from the government which should just about cover the rent and beer.
Which is why more than anything, Obama is dead set on extending insurance benefit payments in perpetuity: because if the 10 million official and 14 million unofficial people who are on benefits (not to mention the tens of millions of unemployed unlucky enough to even get their weekly allowance from Uncle Sam) start thinking about their true predicament and their real "employability", then a landslide loss by this administration at the mid-term elections will actually be an upside surprise to what it can objectively expect.
I figured the explanation would show up in charts somewhere and I asked Chris Puplava at Financial Sense for a chart of Emergency Unemployment Compensation (EUC) Benefits as well as an update on other charts he has graciously provided on request.
From Chris Puplava ...
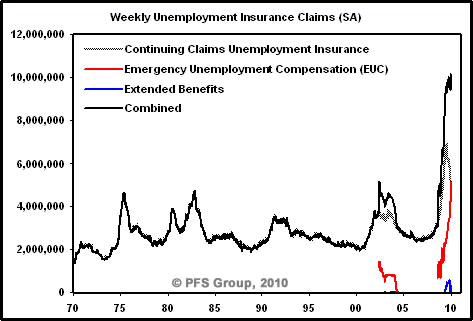
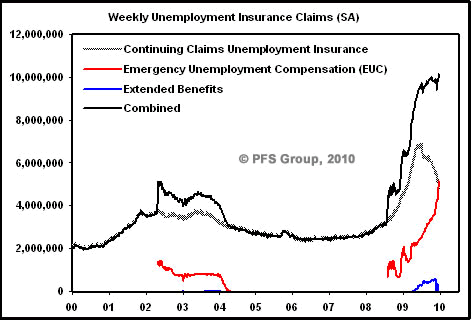
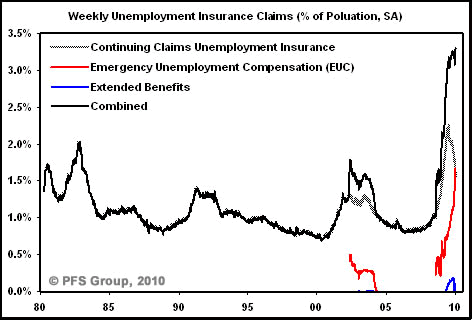
My answer would be a MASSIVE jump in the Emergency Unemployment Compensation (EUC) benefits, which jumped from 3,594,253 (11/07/09) to 5,143,410 (12/19/09), up 43% in just over a month! The increase in EUC more than offset the decline in continuing claims and we are now at a new record when combining all measures of unemployment benefits. Economists were pointing out that continuing claims and initial claims were falling as a bullish sign, however what was happening was that those benefits were exhausting for people who used up that benefit, leading to the decline in the numbers which is proved by a record (52.24%) exhaustion rate.
Record Unemployment Deterioration

However, these people were not finding employment which is why the House passed a bill in December to extend benefits, thus leading to a massive 43% jump in the aptly named “EMERGENCY” Unemployment Compensation program. The jump was so large that now the EUC numbers surpass continuing claims!
The data I have from Moody’s comes with a lag, so the data in the charts below is only updated through 12/19/09, but the combined unemployment claims numbers just broke out to a new record!
Combined Weekly Claims
Combined Weekly Claims Detain Since 2000
Combined Weekly Claims As % Of Population
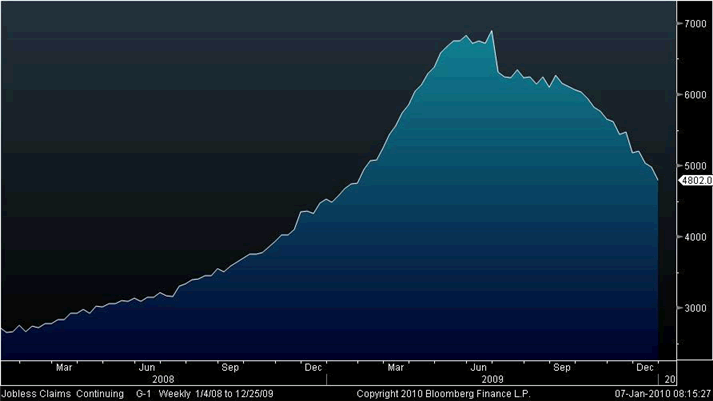
Continuing Claims From Bloomberg
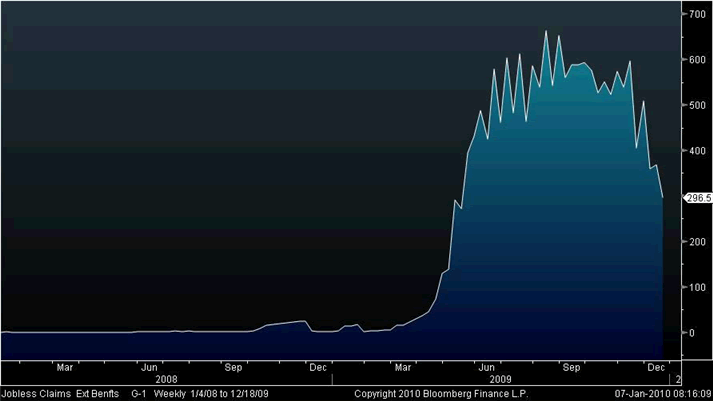
Extended Claims From Bloomberg
Emergency Claims From Bloomberg
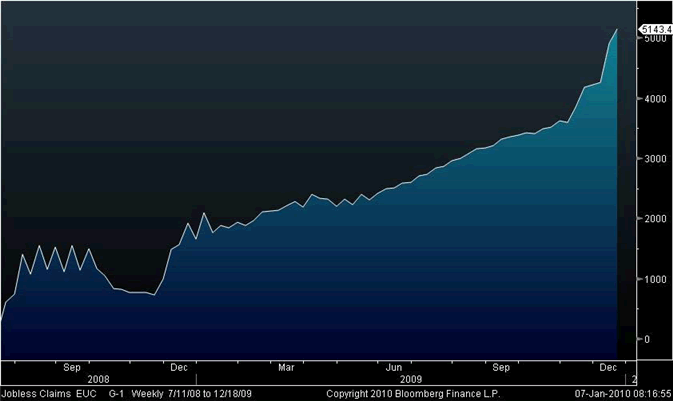
The above charts and commentary all thanks to Chris Puplava at Financial Sense .
Thanks Chris!
4 Week Moving Average Of Weekly Claims
Those charts should help put the "improvement" in weekly claims numbers from the Department of Labor in perspective.
In the week ending Jan. 2, the advance figure for seasonally adjusted initial claims was 434,000, an increase of 1,000 from the previous week's revised figure of 433,000. The 4-week moving average was 450,250, a decrease of 10,250 from the previous week's revised average of 460,500.
BLS Chart of Weekly Claims
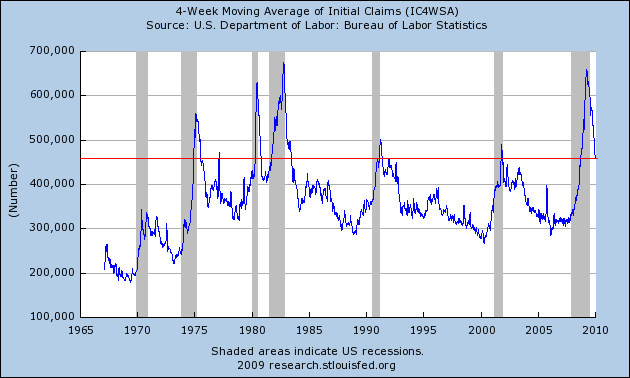
Lovely. The 4-week moving average of initial claims is a whopping 450,000. Yes, that is down from 550,000 or so, last March but it is still consistent with losing jobs. The average needs to get below 400,000 before it is consistent with jobs being added.
Moreover, employers are not firing as many as before, but the above charts show that jobs once lost, are not coming back.
By Mike "Mish" Shedlock
http://globaleconomicanalysis.blogspot.com
Click Here To Scroll Thru My Recent Post List
Mike Shedlock / Mish is a registered investment advisor representative for SitkaPacific Capital Management . Sitka Pacific is an asset management firm whose goal is strong performance and low volatility, regardless of market direction.
Visit Sitka Pacific's Account Management Page to learn more about wealth management and capital preservation strategies of Sitka Pacific.
I do weekly podcasts every Thursday on HoweStreet and a brief 7 minute segment on Saturday on CKNW AM 980 in Vancouver.
When not writing about stocks or the economy I spends a great deal of time on photography and in the garden. I have over 80 magazine and book cover credits. Some of my Wisconsin and gardening images can be seen at MichaelShedlock.com .
© 2010 Mike Shedlock, All Rights Reserved
Mike Shedlock Archive |
© 2005-2022 http://www.MarketOracle.co.uk - The Market Oracle is a FREE Daily Financial Markets Analysis & Forecasting online publication.