Diamonds are not a Stock Trader’s Best Friend
Stock-Markets / Stock Index Trading Jan 08, 2010 - 12:47 AM GMT As a follow-up on the Not-So-Orthodox Broadening Top, I would like to present the idea of yet another extension in the rally that may not be totally unexpected. The saying that, “The markets may remain irrational longer than you can remain solvent.” comes to mind as traders have thrown in the towel multiple times after expecting an end to this rally.

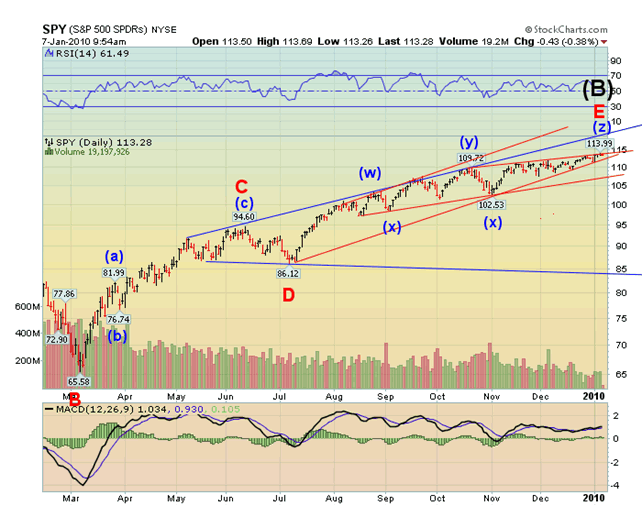
In my earlier article I had presented the idea that the Broadening Top Formation had cloned itself several times over as the market sought to extend through the end of the year. I had drawn a third Broadening Formation in the month of December that I have since replaced with a wedge formation. While trading volume appeared erratic during the broadening formations, it declined dramatically in the month of December, confirming the wedge formation.
You will notice that the relatively strong buying volume in January produced a nominal result, indicating exhaustion and distribution. I would posit that point (w) represents the top of the original (blue) broadening formation. It was followed by point (y), representing the top of the second (red) broadening formation. The third extension (z) has changed its form and character to a wedge. The picture in its entirety takes the form of a Diamond Top.

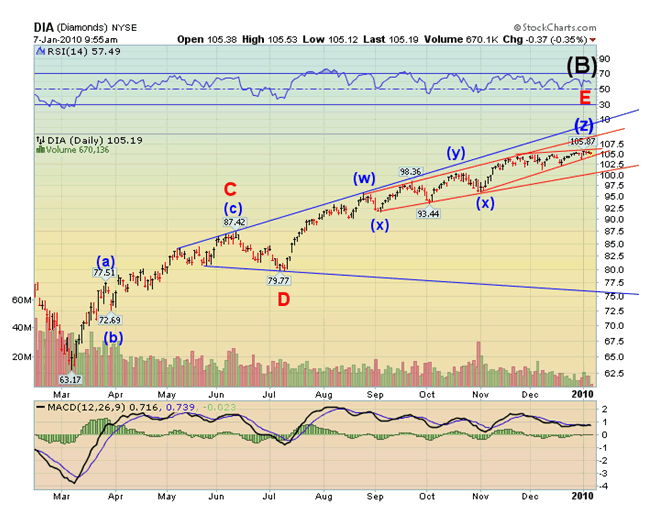
A view of the Diamonds (DIA) produces a very similar result. Although the Diamond formation is not as clear, the formation has the same properties. I have seen several other analyses that have captured portions of the above analysis, but there is no other that I am aware of that has summarized the “big picture.”
For those of you who have knowledge of the Broadening Top, the Rising Wedge or the Diamond formations, the implications are enormous. There are several authors who have written extensively about these technical formations, including Edwards, Magee & Bassetti (Technical Analysis of Stock Trends), John Murphy (Technical Analysis of the Futures Markets) and Thomas Bulkowski (Encyclopedia of Chart Patterns). I have used all of these authors as my sources in order to maintain accuracy and reliability in my analysis.
Our Investment Advisor Registration is on the Web
We are in the process of updating our website at www.thepracticalinvestor.com to have more information on our services. Log on and click on Advisor Registration to get more details.
If you are a client or wish to become one, please make an appointment to discuss our investment strategies by calling Connie or Tony at (517) 699-1554, ext 10 or 11. Or e-mail us at tpi@thepracticalinvestor.com .
Anthony M. Cherniawski,
President and CIO
http://www.thepracticalinvestor.com
As a State Registered Investment Advisor, The Practical Investor (TPI) manages private client investment portfolios using a proprietary investment strategy created by Chief Investment Officer Tony Cherniawski. Throughout 2000-01, when many investors felt the pain of double digit market losses, TPI successfully navigated the choppy investment waters, creating a profit for our private investment clients. With a focus on preserving assets and capitalizing on opportunities, TPI clients benefited greatly from the TPI strategies, allowing them to stay on track with their life goals
Disclaimer: The content in this article is written for educational and informational purposes only. There is no offer or recommendation to buy or sell any security and no information contained here should be interpreted or construed as investment advice. Do you own due diligence as the information in this article is the opinion of Anthony M. Cherniawski and subject to change without notice.
Anthony M. Cherniawski Archive |
© 2005-2022 http://www.MarketOracle.co.uk - The Market Oracle is a FREE Daily Financial Markets Analysis & Forecasting online publication.


