Composition of the U.S. Money Supply
Economics / Money Supply Jul 24, 2007 - 08:58 PM GMTBy: Mike_Hewitt
 How much U.S. money is in circulation? Printed currency and coins amount to less than US$800 billion. This represents only a small portion of the total money supply. The following essay shows the composition of various monetary aggregates used by the Federal Reserves to define the total amount of money available.
Monetary Aggregates
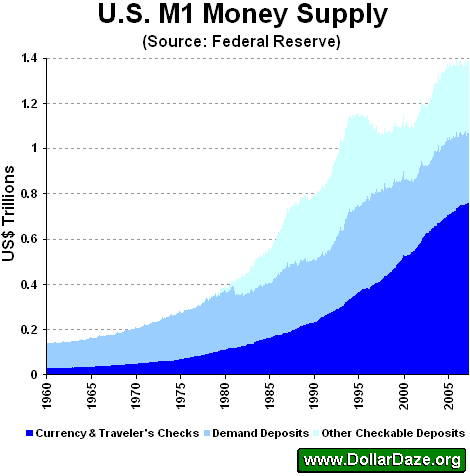
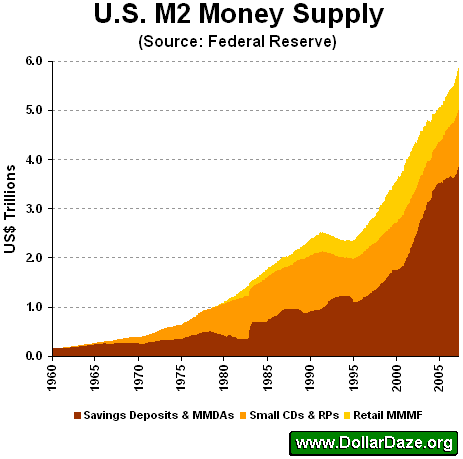
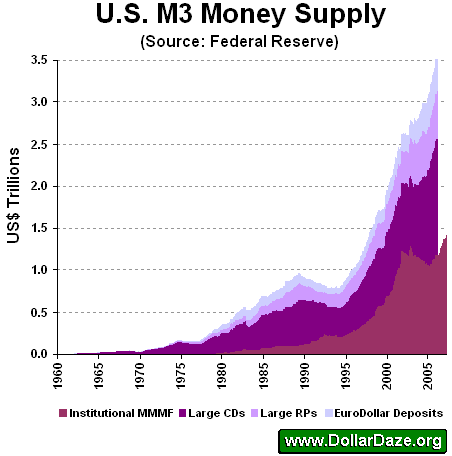
The U.S. Federal Reserve commonly uses, or used in the case of M3, four different monetary aggregates to measure the supply of money. M1 is the narrowest definition of money supply while M3 is the broadest. The following graphs show the composition of the various categories for each monetary aggregate.
M1 includes physical currency (minted coins and printed paper), traveler's checks (<2% of all currency), demand deposits (checking accounts that pay no interest) and other checkable deposits. This last group includes checking accounts that pay interest, including negotiable order of withdrawal (NOW) accounts.
M2 includes M1, plus most savings accounts and money market deposit accounts (MMDAs). The latter are high yielding bank deposits that offer limited check-writing privileges. They are similar to money market fund shares but are issued either by banks or by the Federal Deposit Insurance Corporation (FDIC). Also included are small denomination (<$100,000) repurchase agreements (RPs) and certificate of deposit accounts (CDs). Finally, M2 includes retail or non-institutional money market mutual fund (MMMF) shares owned by individuals.
M3 was largely discontinued as of March 23, 2006. The only measure still published is institutional money market mutual fund (MMMF) shares. M3 includes M2, plus large denominated (>$100,000) certificate of deposit accounts and repurchase agreements. Finally, M3 includes deposits of eurodollars.
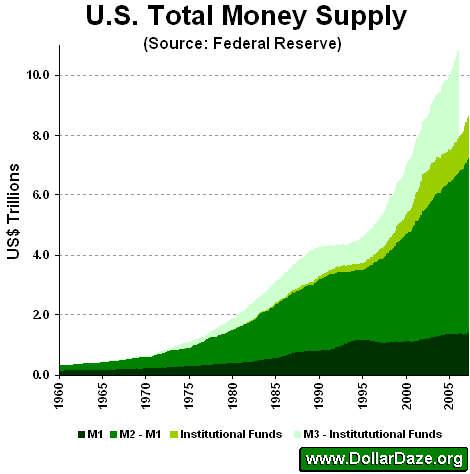
The following graph compiles data from M1, M2 and M3 to show the total U.S. money supply.
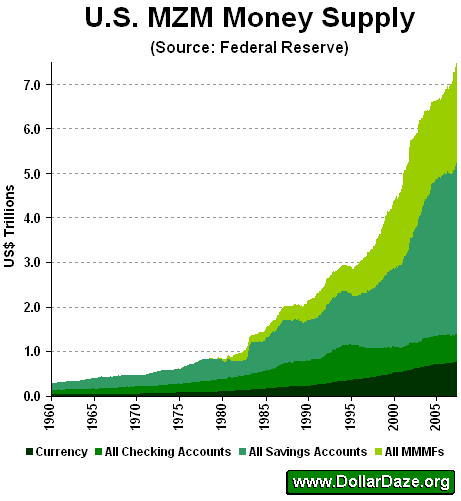
MZM (Money Zero Maturity) has recently become the preferred measure of money supply used by the Federal Reserve. They state that this monetary aggregate better represents money readily available within the economy for spending and consumption.
MZM is a measure of all liquid money supply within an economy. An MZM asset is one that can be immediately redeemed without suffering a penalty or a capital loss. MZM represents all money in M2 less the time deposits, plus all money market funds.
Controlling the Money Supply
The Federal Reserve can control the money supply through three mechanisms:
- Setting the Federal Funds Rate : By decreasing interest rates and effectively making money less expensive to borrow, the Federal Reserve increases the demand for money. It is less clear if the same process works in reverse. Raising interest rates from 5% to 7% may not be very effective at decreasing demand for money if CPI inflation also increases 2% during the same time period.
- Buying U.S. Government Treasuries : When the Federal Reserve purchases U.S. treasuries it loans money to the U.S. government. In addition to the money created by the Fed to purchase these treasuries, the assets of the Federal Reserve increase allowing them to lend more to their clients under the fractional reserve banking system.
- Adjusting the Reserve Ratios : All banks operate under a fractional reserve banking system whereby they must legally hold a set amount of cash reserves against the amount they lend out to their customers. By adjusting the reserve ratio limits, the Federal Reserve can affect the amount of money commercial banks are able to lend. Increasing these ratios, deflates the money supply because banks can no longer lend out as much as before. Decreasing them has the opposite effect. Since December 21, 2006 the reserve ratios are as follows:
| U.S. Reserve Requirements | |
| Amount of Liability | Reserve Required |
| $0 to $8.5 million | 0% |
| $8.5 million to $45.8 million | 3% |
| More than $45.8 million | 10% |
Inflation and Deflation
Inflation refers to an increase in the money supply. Deflation is the opposite. Rising prices for goods and services may be a result of increased demand relative to supply, but may also be a result of the devaluation of the currency used to purchase these items. Currency becomes devalued when its supply is increased. It is subject to the dynamics of supply and demand just like any other good.
Consumer Price Index (CPI) calculations report that "inflation" is rising at about 2% per annum. The charts above clearly show a rate of increase much higher than that and one more in line to what everyday consumers are experiencing at the cash register. That being somewhere between 7-14%.
Decreasing prices may result from a declining demand to supply ratio, an increase in the value of the currency, or from manufacturing improvements via technology and/or more efficient distribution processes.
The falling costs of electronics and telecommunications equipment is not deflationary. Nor is it an evil as the Central Banks proclaim. Lower prices encourage higher consumption not the other way around. Those market participants who formerly could not purchase the desired goods are now able to. The more affluent members of the same market may now opt to buy additional units of the same item.
By Mike Hewitt
http://www.dollardaze.org
Mike Hewitt is the editor of www.DollarDaze.org , a website pertaining to commentary on the instability of the global fiat monetary system and investment strategies on mining companies.
Disclaimer: The opinions expressed above are not intended to be taken as investment advice. It is to be taken as opinion only and I encourage you to complete your own due diligence when making an investment decision.
Mike Hewitt Archive |
© 2005-2022 http://www.MarketOracle.co.uk - The Market Oracle is a FREE Daily Financial Markets Analysis & Forecasting online publication.
Comments
|
andy
25 Jul 07, 08:39 |
what about credit
What about credit and funny money, which represents a mountain compared with this large mole hill |


