GOLD: What's Next?
Commodities / Gold & Silver Jul 24, 2007 - 08:00 PM GMTBy: Aden_Forecast
The nagging reality that gold's bull market is 6 ½ years old has caused many to think that gold should have a decent correction this year.
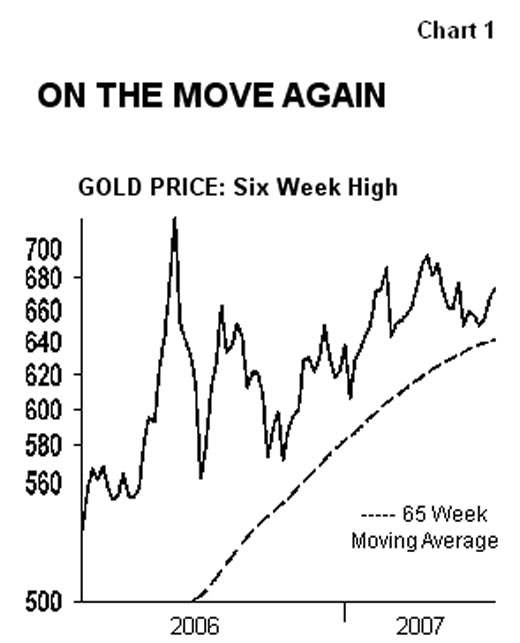
Who would've thought in May, 2006 when gold shot up to $722 that a year later gold would have trouble getting near the $700 level? This does sound toppy, but gold is telling us to stay invested.
From its May, 2006 peak, gold fell for several months until it reached a low in October 06 (see Chart 1 ). This was the low at $562 and gold has been rising since then… for nine months now.

Each low since October, in January and in March, has been higher, which is why the March low at $640 is important. As long as gold stays above $640, the higher highs will stay in force and gold will also be staying above its 65-week moving average. This average is the key uptrend in the bull market. So while you could say gold looks toppy, you could also say it has a solid base.

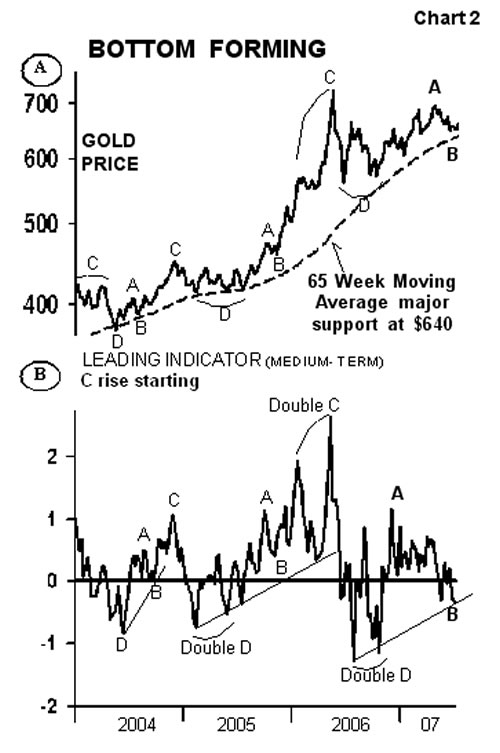
Chart 2B shows our normally great gold timing indicator. It works well in identifying intermediate moves in gold and it warns of possible changes in the major trend. The C rises tend to be the best intermediate rise in gold's recurring cycle when it reaches a new bull market high.
The flip side are the D declines. They tend to be the worst intermediate declines in a bull market, but their lows are higher than the previous B lows.
A double D low occurred last year but this year the A through C movements haven't been too clear.
Now, however, it looks like the April 20 high was an extended, longer than normal A rise (from last October to April ), and gold then moved lower in a B decline. B declines tend to be mild, which has been the case so far, and a bottom appears to be forming.
WHERE GOLD CURRENTLY STANDS
If gold now stays above $670, a C rise will clearly be underway. Gold could then test $696, the April high and once that's broken, $722 will be the next stop. Above $722 would mean a strong C rise and a strong bull market are underway.
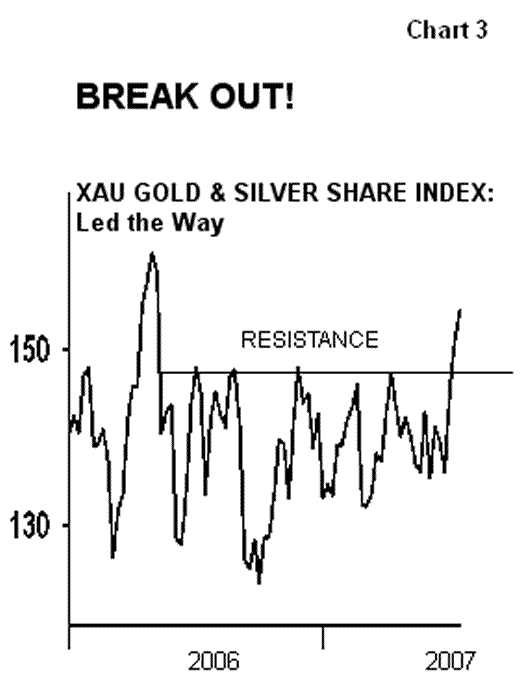
Basically, the metals are looking good. Gold shares led the way by rising strongly and gold is following (see Chart 3 ). The weaker dollar, the subprime situation, rising oil, fund buying, geopolitical tensions and the first signs of a flight to quality are all boosting the market.

Plus, gold shares are showing solid strength. The XAU gold & silver share index is at a 14 month high and it's super strong above 145. Likewise for the HUI index above 343.

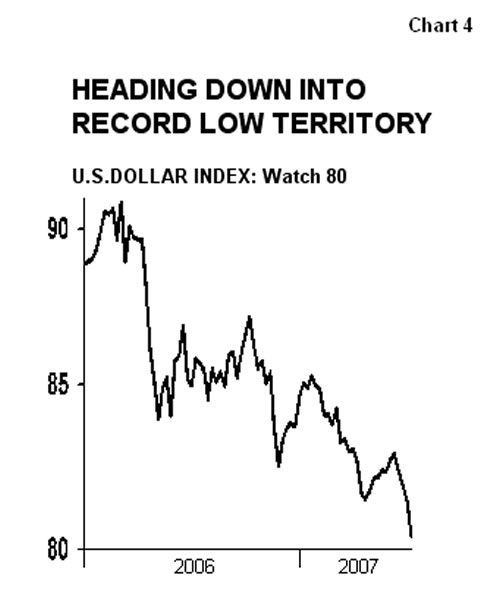
The U.S. dollar index is also starting to break down into new record low territory (see Chart 4 ). This will be confirmed once the dollar index (basis September) declines and stays below 80. With several of the currencies hitting multi-decade highs and gold moving up strongly, this will probably happen soon. And when it does, the dollar will likely fall sharply. That'll be super bullish for gold and it'll likely then propel it to new highs.
By Mary Anne & Pamela Aden
Mary Anne & Pamela Aden are well known analysts and editors of The Aden Forecast, a market newsletter providing specific forecasts and recommendations on gold, stocks, interest rates and the other major markets. For more information, go to www.adenforecast.com
Aden_Forecast Archive |
© 2005-2022 http://www.MarketOracle.co.uk - The Market Oracle is a FREE Daily Financial Markets Analysis & Forecasting online publication.


