


S&P 500, NDX Range Breakout
Stock-Markets / Stock Index Trading Jan 05, 2010 - 03:51 AM GMTBy: Piazzi

 Well, Holidays are over.
I think I left my readers in a very good shape with a very valid and solid setup.
If you remember, I kept posting two 60-min range charts with targets to each side. All one had to do was to go initiate a trade on the break of the range.
This is the updated chart for Nas100
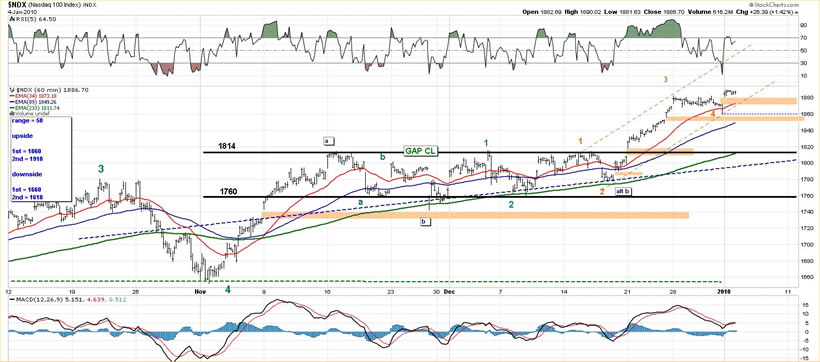
NDX broke to the upside and did not look back until 1880. A 70-point power run that must have taken care of a lot stops and short positions, hitting and exceeding my first target in the process
The second range target may become harder to achieve as many who are left behind try to catch a ride on a pullback and may become distribution targets. In addition, there may not be as many shorts in the system to fuel the run. So, a more cautious stance may be warranted
This is the updated chart for S&P
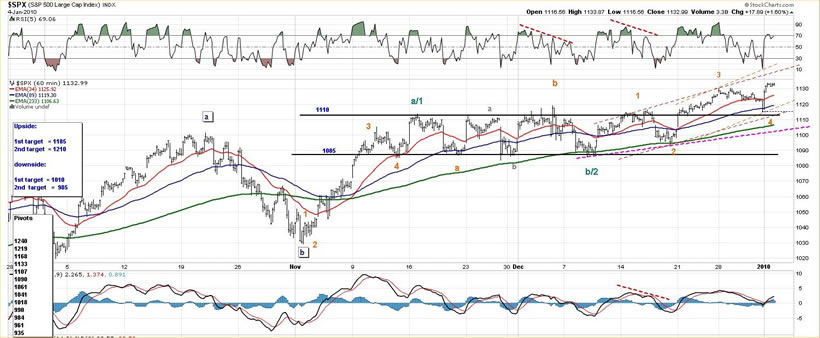
S&P broke to the upside of the range. It has not been packing as serious punch a NDX, not yet anyways. It still is well short of my targets. It did a very nice retest of the top of the range, offering a very low risk entry.
Both indexes have put in an almost complete 5-wave set. They will soon show us whether this wave set is all they had left after the breakout of their ranges or if this is the beginning of an extended wave structure.
The low risk entries are now rather behind us.
NDX has a number of open gaps. In a previous post, I pointed out to the gap around the 1870 area and wondered if it was an exhaustion gap. It indeed was an exhaustion gap as NDX soon rolled over into its small wave 4 correction.
Today, NDX opened with another gap, and I wonder if that is the gap before completion of the ongoing wave 5.
All in all, market has had very positive price action. It was led higher by the tech sector, which is also positive.
On the other hand, most of the best of the rallies came on lackluster volume and during overnight session (that’s why you see so many gaps on NDX chart).
As things stand, NDX needs a move below 1850 to turn the short term down. S&P needs a move below 1111 to turn the short term trend down.
As long as that has not happened, mid-term trend is up, and short term trend is up. In addition, our OEW long term trend has also turned up.
Support on S&P is 1107 and 1090. Resistance is 1133 pivot, which has so far kept S&P in check, and 1168.
Have a Very Happy New Year!
By Piazzi
http://markettime.blogspot.com/
I am a self taught market participant with more than 12 years of managing my own money. My main approach is to study macro level conditions affecting the markets, and then use technical analysis to either find opportunities or stay out of trouble. Staying out of trouble (a.k.a Loss) is more important to me than making profits. In addition to my self studies of the markets, I have studied Objective Elliott Wave (OEW) under tutorship of Tony Caldaro.
© 2010 Copyright Piazzi - All Rights Reserved Disclaimer: The above is a matter of opinion provided for general information purposes only and is not intended as investment advice. Information and analysis above are derived from sources and utilising methods believed to be reliable, but we cannot accept responsibility for any losses you may incur as a result of this analysis. Individuals should consult with their personal financial advisors.
© 2005-2022 http://www.MarketOracle.co.uk - The Market Oracle is a FREE Daily Financial Markets Analysis & Forecasting online publication.