Stock Market 2003 and 2009 Rallies Hard Facts!
Stock-Markets / Stock Markets 2010 Jan 04, 2010 - 03:28 AM GMTBy: G_Abraham
 We have been hearing about the similarity between 2003 and 2009 rallies. I decided to look at some hard facts and see if there was a correlation at least visually speaking that is.
Important similarities.
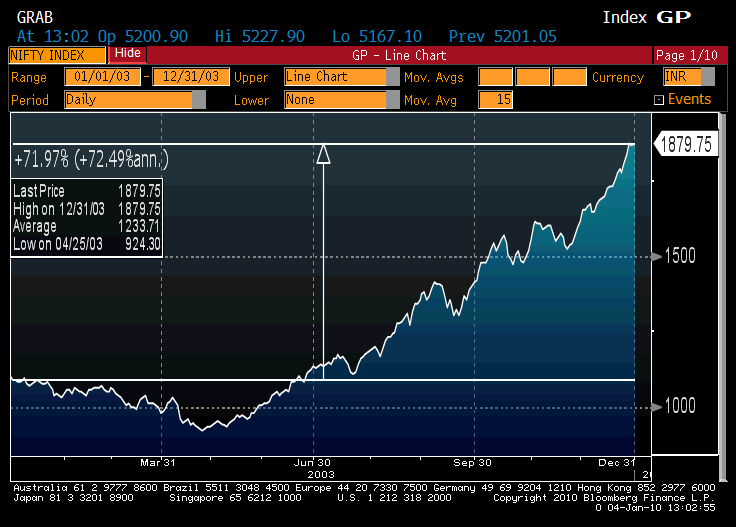
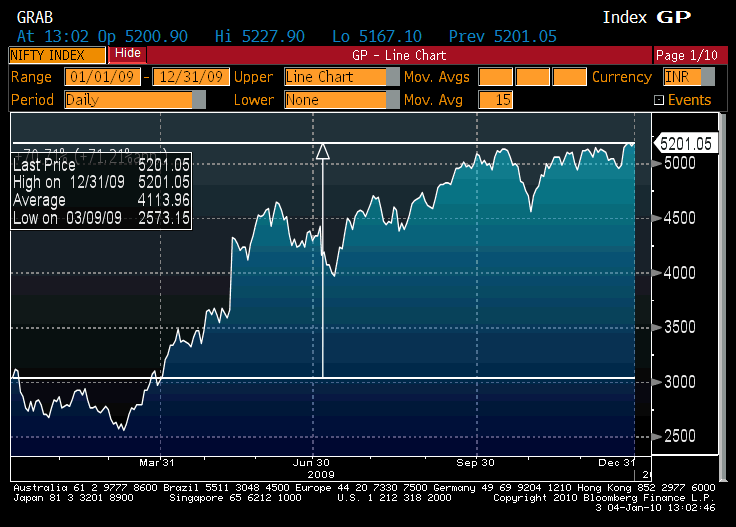
1. Like to Like comparison – In 2003 the markets were up approx 72% (see 2003 performance chart attached) and in 2009, the markets were up approx 71% (see 2009 performance chart).

2. Market rallies began around the same time frame in Mar/Apr of respective years. In 2003 we were coming out from dot-com/corporate problems/security issues. In 2009, we came out from debt/credit crisis.

Given the similar movements in 2003 and 2009, let is look at markets in 2004 and a couple of things stood out:
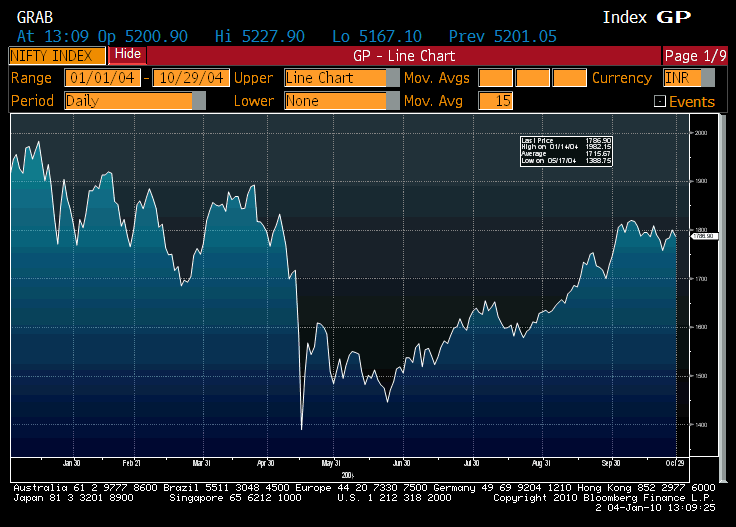
1. Market was largely flat until end-Oct 2004/end-Nov 2004 – 2004 was a year of elections and the NDA lost out giving a sharp drop in Apr/May. Outside of that markets from Jan-Oct/Nov were largely flat (see Jan-Oct 2004 graph).

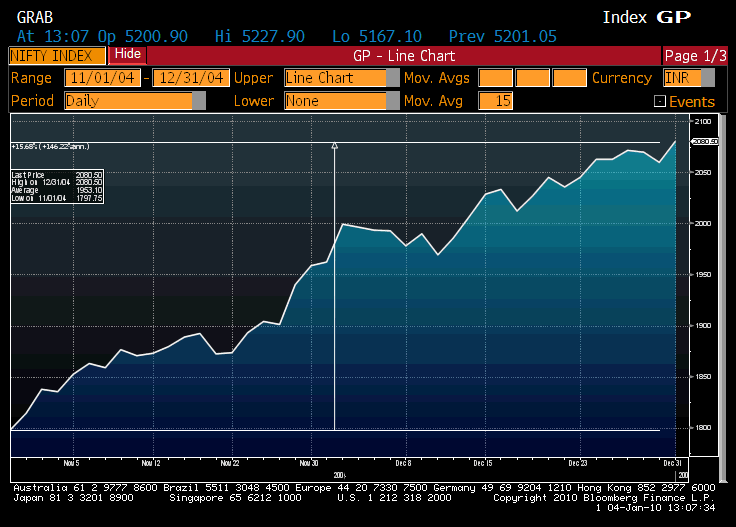
2. Oct-Dec saw sustained rally – From Oct-Dec 2004 market saw a sustained rally of approx 15% to end the year higher by 8.8% (see Oct-Dec 2004 graph).

Sectors that out-performed in 2004 – Banks (+31%), Small/Mid-caps (38% – small, 24% – mid-caps), Healthcare (21%), and Cap Goods (27%).
Sectors that under-performed in 2004 – FMCG (-7%) and Oil & Gas (-2%).
Source: http://investingcontrarian.com/?p=2164
Godly Abraham
http://investingcontrarian.com/
Formerly a hedge fund analyst for India's largest fund house and currently a Private Equity fund analyst with a swiss firm, Godly Abraham is an active writer at INVESTING CONTRARIAN which is a daily online publishing house, covering investing ideas and economic analysis on wide ranging topics but mainly specialized to covering US,UK, EU and BRIC countries and their political ramifications.
© 2010 Copyright Godly Abraham - All Rights Reserved
Disclaimer: The above is a matter of opinion provided for general information purposes only and is not intended as investment advice. Information and analysis above are derived from sources and utilising methods believed to be reliable, but we cannot accept responsibility for any losses you may incur as a result of this analysis. Individuals should consult with their personal financial advisors.
© 2005-2022 http://www.MarketOracle.co.uk - The Market Oracle is a FREE Daily Financial Markets Analysis & Forecasting online publication.


