


New Year ETF Trading for Stocks, Gold, Crude Oil and Natural Gas
Stock-Markets / Financial Markets 2010 Jan 04, 2010 - 02:20 AM GMTBy: Chris_Vermeulen

 Welcome back everyone! It’s time to buckle up and get ready for another exciting year of trading.
When the market is moving on light volume I tend to focus on very short term plays to minimize my exposure to volatility. The past couple of weeks have been great for day traders and futures trades as we took advantage of the short term seasonal holiday rally in the broad market and also by shorting gold when bounces reached resistance levels.
This year I will be providing many more trades as I focus more on 60 minute trading charts to scalp the market with low risk quick reward setups. Also I will start providing futures trading analysis and signals for those who want to be more active and generate more income on a monthly basis.
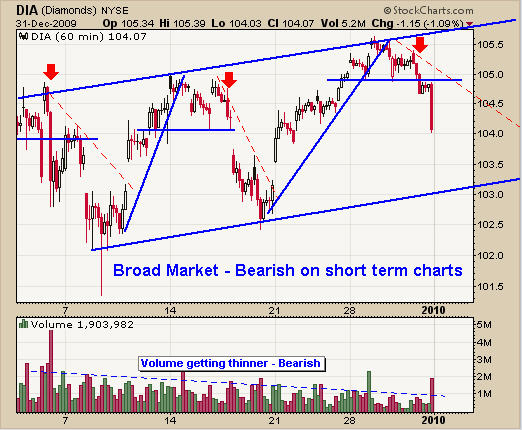
DIA – Dow Jones Exchange Traded Fund – 60 Minute Chart
The Dow has been trading in this range for a couple weeks providing some excellent short plays. Although I tell members not to short in a bull market, there are times when shorting in a bull market looks and feels right. The past month has been the perfect mix for shorting using the 60 minute charts.
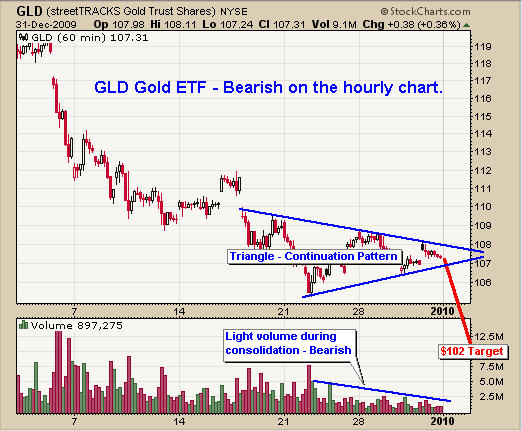
GLD – Gold Exchange Traded Fund – 60 Minute Chart
Gold is in a strong bull market but the short term charts have provided over 13 short trades in the past 2 weeks for futures traders playing the bounces to resistance levels. The triangle on the 60 minute chart with declining volume is a continuation pattern of the short term trend which is down.
Because gold is trading near a support level on the daily chart, I am waiting patiently for a perfect setup to go short, or long depending on what happens in the coming hours. I predict lower prices with $102 area for the next support level.
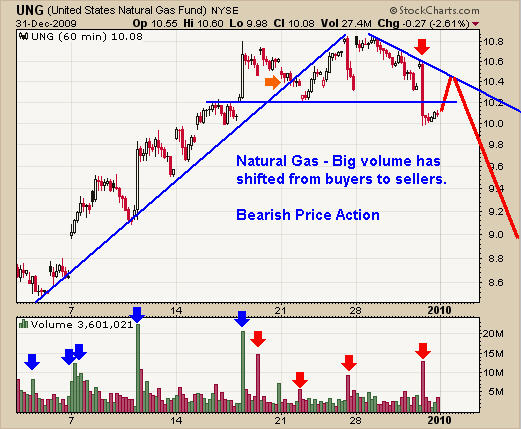
UNG – Natural Gas Fund – 60 Minute Chart
Natural gas is trading at resistance on the daily and weekly charts. This 60 minute chart allows us to take a closer look at the intraday momentum which clearly shows there are more sellers than buyers at this level. I see lower prices in the coming hours/days.
UNG not a good fund for holding positions more than 2 weeks, it does provide excellent trading opportunities for day traders and 60 minute chart setups.
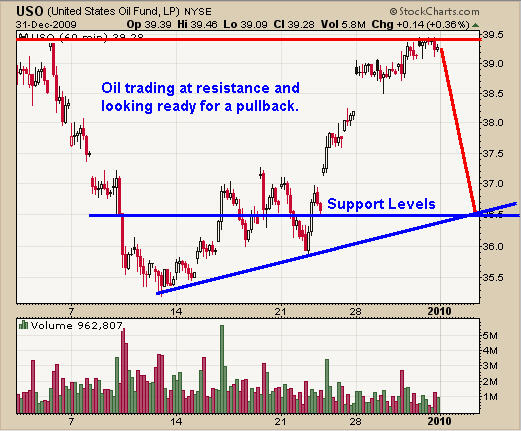
USO – Crude Oil Fund – 60 Minute Chart
Crude oil had a perfect bounce off of a support level on the weekly and daily charts back on the 14th. Oil is now trading at a short term resistance level and I feel it will head lower in the coming days. We still need more price action before taking a position. Let’s watch and wait.
Trends of Gold, Dow, Oil and Natural Gas Conclusion:
The broad market and commodities listed above seem to be trading at resistance levels with signs of rolling over. As a technical trader the charts do all the talking and they are pointing to lower prices in the near term which falls in line with my gut feeling that a sharp pullback across the board is lurking in January. Once the big money start getting pushed around again we will know who is in control, buyers or sellers.
Let’s continue to focus on these short term charts to take advantage of any low risk setups which come our way.
If you would like to receive my Free Weekly Trading Reports like this please visit my website: www.TheGoldAndOilGuy.com
To Your Financial Success,
By Chris Vermeulen
Chris@TheGoldAndOilGuy.com
Please visit my website for more information. http://www.TheGoldAndOilGuy.com
Chris Vermeulen is Founder of the popular trading site TheGoldAndOilGuy.com. There he shares his highly successful, low-risk trading method. For 6 years Chris has been a leader in teaching others to skillfully trade in gold, oil, and silver in both bull and bear markets. Subscribers to his service depend on Chris' uniquely consistent investment opportunities that carry exceptionally low risk and high return.
This article is intended solely for information purposes. The opinions are those of the author only. Please conduct further research and consult your financial advisor before making any investment/trading decision. No responsibility can be accepted for losses that may result as a consequence of trading on the basis of this analysis.
Chris Vermeulen Archive |
© 2005-2022 http://www.MarketOracle.co.uk - The Market Oracle is a FREE Daily Financial Markets Analysis & Forecasting online publication.