British Politicians Lying to the Electorate, NHS Budget 4% Cut (Minimum)
ElectionOracle / NHS Jan 03, 2010 - 09:36 PM GMTBy: Nadeem_Walayat
 Whilst both political parties profess to not only not cut the NHS budget but to increase spending over the coming years. The fact is that the NHS budget under the Labour government has grown to a level that risks bankrupting the country. In nominal terms the budget has increased from £37 billion in 1997 to approx £120 billion for 2009, a more than tripling of the budget.
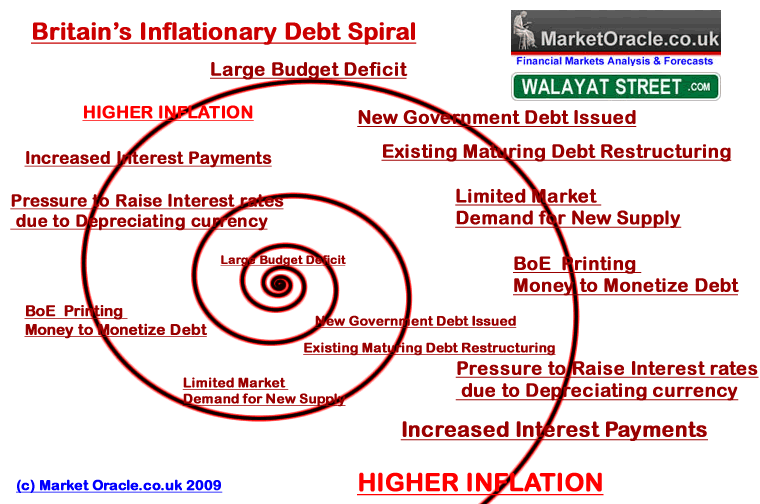
However a more accurate measure of the increase of the budget is as a percentage of Gross Domestic Product (GDP), in this regard the NHS has grown from 6% of GDP in 1997 to 10% of GDP now, therefore Britain is paying 66% more in NHS spending as a proportion of the economy will little improvement in service delivery due to a near continuous fall in productivity. This and other rampant out of control public spending under the Labour government risks bankrupting Britain as the ANNUAL budget deficit now exceeds 14% of GDP (£180 billion) which requires urgent action to prevent igniting an inflationary debt interest spiral i.e. where the interest paid on accrued debt results in a mushrooming of the countries total debt burden that tips the economy towards an hyperinflationary price spiral economic collapse as the following graphic illustrates.

Therefore both major political parties are lying to the electorate when they state that the NHS budget will not only not be cut but increase spending over the coming years. So far only Labour has actually released their NHS spending plans which show an increase of £3.7 billion / 3% per year for the next 3 years, whilst the Conservatives have pledged to match Labour NHS spending plans.
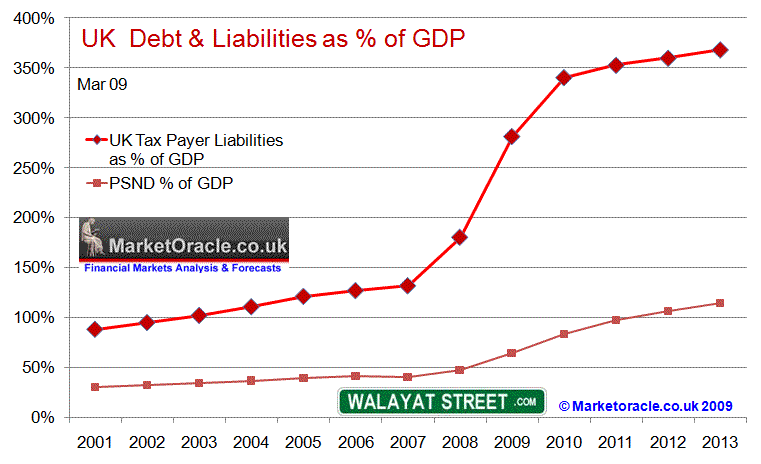
The next government will have NO CHOICE but to cut NHS spending, as the Labour party current plan for cutting the annual budget deficit by £23 billion a year just do not stand up to scrutiny as it would still result in the budget deficit expanding by £510 billion over the next 5 years, i.e. to more than 114% of Public Sector Net Debt which the financial markets would NOT tolerate, i.e. it would result in a series of bond market auction failures, which would be countered with accelerating money printing to monetize the debt which would culminate in an Iceland style currency collapse as foreign investors panic to preserve the value of their capital by selling out of sterling in favour of other currencies.

NHS Spending Out of Control
 The Labour government despite tripling the NHS budget / GP Pay over the past 10 years to £120 billion ($198 billion) has resulted in a continuous fall in productivity over the past 6 years or so, and is only now in the final few months of its government for electioneering making announcements to implement reforms necessary to drag the NHS into the 21st century with a view to putting the patient first for the first time since its creation.
The NHS in its present form is a funding black hole with falling productivity that is sucking in ever increasing amounts of cash in real terms. Real reforms are urgently required otherwise Britain will be heading for a health service crisis as the GDP share of health spending continues to expand from 3.5% in 1948 to 10% today to above 13% by 2020, all without any real improvement in patient healthcare.
Politicians Scared of NHS Voter Army
The reason why politicians are lying about cuts to the NHS budget of at least 4% is because over 1.2 million Brit's ride the NHS gravy train and hence have a vested interest in the continuance of this sacred cow funding black hole that continues to exert a sizeable political force that political parties have little choice but to pander towards to ensure electoral success.
NHS GP Pay Illustrates Out of Control Spending
British MP's were humiliated during May and June across all parties as public outrage and indignation oat the abuse of the MP expenses system with MP's responding with how MP pay has failed to keep pace with that of NHS GP's which is one of the key reasons as to why they had resorted to what amounts to legalised theft from the electorate.
MP - NHS GP Pay Comparison

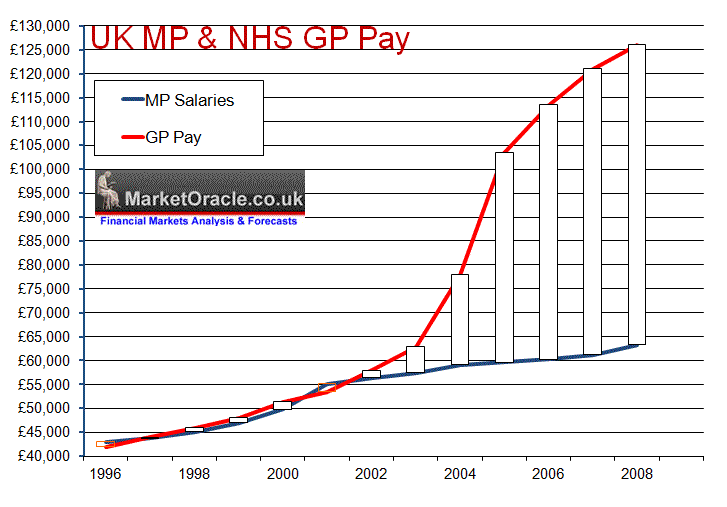
When Labour came to power in 1997 average MP pay was £43,722 against average NHS GP pay of £44,000, so both were inline with one another at that time. However as the above graph clearly illustrates in 2003 something started to go seriously wrong with GP Pay which took off into the stratosphere as GP's decided to award themselves pay hikes of more than 30% per annum at tax payers expense that has lifted average GP pay to £126,000 per annum against £64,000 for MP's.
How could this happen, unfortunately this was as a consequence of the now infamous GP contracts where to be blunt greedy GP's hoodwinked gullible incompetent Labour government health ministers into signing upto contracts which were meant to deliver greater value for money for the tax payer but were designed to do the opposite and resulted in GP's pay doubling whilst at the same time cutting back on hours worked. This was not only a total fiasco for the nations health and finances but also ignited jealousy amongst MP's that directly led to the adoption of the policy of claiming expenses to the maximum so as to fill the ever widening gap between MP's and NHS GP's, as MP's could NOT get away with awarding themselves pay hikes of 30% per annum without losing their seats at the next general election in response to voter outcry, therefore across the board systematic abuse of expenses started to take place which basically means real average MP pay is currently approx £98,000 per annum.
Spending Cut would Have Little Impact on an Uncompetitive NHS
The NHS has become so unproductive, that a cut of 4% would be have little cut on the actual performance of the NHS as all that is required is competent management of the NHS so that those employed by the NHS performed more efficiently.
The cut in the NHS budget could be coupled with market reforms such as those already announced for GP practices that proposes to allow patients real choice of GP for the first time. If money walked with the patient then that would ensure that the patient receives competent healthcare, as under the current system there exists little if no incentive to put the patient first which is borne out time and time again in analysis, reports and polling amongst NHS frontline staff. The current system is designed to to yield the most money for the least amount of work as we have witnessed with the GP contracts.
Therefore a form of health insurance / credit card system MUST be implemented where the Patient CHOOSES which hospital or GP surgery to PURCHASE healthcare from regardless of whether it be a government run NHS institution or a privately run hospital as analysis consistently suggests there exists a huge discrepancy in the quality of GP services between affluent areas of the country and deprived areas which has contributed to a 20 year gap in life expectancy (UK Swine Flu Pandemic NHS Online Service to Bypass Inept GP Surgeries), only then will the patient come first and receive the treatment that they deserve rather than the current half way house that costs more and repeatedly fails to deliver the price of which is unnecessary illness and early deaths.
City of Sheffield NHS GP Cuts Case Study
The data compiled by the Department of Health funded UK GP Patient Survey conducted by Ipsos MORI during early 2009 that sent out a questionnaire to 5.7 million NHS GP patients and therefore comprises the most comprehensive data available as to patient feedback of actual experience of using GP Services. In total 57,759 questionnaires were sent out to Sheffield patients of which 24,696 were returned or 42.75% (click here for a sample survey).
Whilst the questionnaire contained many fields, however the most relevant fields towards the rating of Sheffield's GP Surgeries is the level of overall patient satisfaction with the quality of healthcare at the GP surgeries for all of the 91 Sheffield GP surgeries in order of most overall satisfaction experienced.
Out of the full list of 91, the follow represent the bottom 10 performing GP surgeries as per the Patient Survey that could be singled out to be cut or if a real patient choice system were implemented would be expected to lose their patients to better run more cost effective GP surgeries, therefore resulting in both saving costs and for greater patient satisfaction.
| Surgery Rank (1-91) | Practice name | Total survey forms distributed | Total completed forms received | Response rate (%) | % Very satisfied | % Fairly satisfied | % Neither satisfied nor dissatisfied | % Fairly dissatisfied | % Very dissatisfied | % Satisfied (total) |
| 82 | CROOKES VALLEY MEDICAL CENTRE | 1,063 | 278 | 26% | 50% | 34% | 10% | 4% | 2% | 84% |
| 83 | CARRFIELD MEDICAL CENTRE | 655 | 242 | 37% | 51% | 33% | 11% | 4% | 1% | 84% |
| 84 | SHEFFIELD MEDICAL CENTRE | 784 | 212 | 27% | 56% | 28% | 11% | 2% | 2% | 84% |
| 85 | STONECROFT MEDICAL CENTRE | 501 | 274 | 55% | 42% | 42% | 9% | 6% | 1% | 84% |
| 86 | HAROLD STREET MEDICAL CENTRE | 886 | 255 | 29% | 47% | 35% | 11% | 5% | 2% | 82% |
| 87 | WESTFIELD HEALTH CENTRE | 663 | 255 | 38% | 47% | 35% | 13% | 4% | 2% | 81% |
| 88 | WOODHOUSE MEDICAL CENTRE | 570 | 292 | 51% | 36% | 43% | 11% | 6% | 4% | 79% |
| 89 | DARNALL HEALTH CENTRE (MEHROTRA) | 659 | 269 | 41% | 32% | 43% | 16% | 6% | 2% | 76% |
| 90 | DARNALL COMMUNITY HEALTH | 779 | 285 | 37% | 23% | 51% | 10% | 13% | 3% | 74% |
| 91 | HIGHGATE SURGERY | 1,000 | 264 | 26% | 28% | 39% | 15% | 8% | 11% | 66% |
Data Source - http://results.gp-patient.co.uk/report/main.aspx
By Nadeem Walayat
http://www.marketoracle.co.uk
Copyright © 2005-10 Marketoracle.co.uk (Market Oracle Ltd). All rights reserved.
Nadeem Walayat has over 20 years experience of trading derivatives, portfolio management and analysing the financial markets, including one of few who both anticipated and Beat the 1987 Crash. Nadeem's forward looking analysis specialises on the housing market and interest rates. Nadeem is the Editor of The Market Oracle, a FREE Daily Financial Markets Analysis & Forecasting online publication. We present in-depth analysis from over 500 experienced analysts on a range of views of the probable direction of the financial markets. Thus enabling our readers to arrive at an informed opinion on future market direction. http://www.marketoracle.co.uk
Disclaimer: The above is a matter of opinion provided for general information purposes only and is not intended as investment advice. Information and analysis above are derived from sources and utilising methods believed to be reliable, but we cannot accept responsibility for any trading losses you may incur as a result of this analysis. Individuals should consult with their personal financial advisors before engaging in any trading activities.
Nadeem Walayat Archive |
© 2005-2022 http://www.MarketOracle.co.uk - The Market Oracle is a FREE Daily Financial Markets Analysis & Forecasting online publication.


