UK CPI Inflation Forecast 2010, Imminent and Sustained Spike Above 3%
Economics / Inflation Dec 27, 2009 - 10:53 AM GMTBy: Nadeem_Walayat
 The UK inflation forecast for 2010 is first of a three part series of in depth analysis as part of the inflation mega-trend, with UK interest rates and GDP growth forecast to follow in the coming week. The whole scenario and implications of will be published as an ebook that I will make available for FREE. Ensure you are subscribed to my always free newsletter to get the latest analysis in your email box and check my most recent analysis on the unfolding inflation mega-trend at http://www.walayatstreet.com.
Inflation Forecast 2009
The UK Inflation forecast for 2009 (30 Dec 2008 - UK CPI Inflation, RPI Deflation Forecast 2009) proved remarkably accurate with the road map contributing towards the generation of many accurate projections for subsequent trends throughout 2009 and not least for UK savers that for those that followed my cue of fixing savings at rates of above 5% for 1 - 2 years would not have been burned by the subsequent crash in UK interest rates to pittance of as low as 0.1% on savings accounts across the bailed out banking sector and later for stock market investors that monetized on the stealth bull market that began in March 2009 the genesis for which was in the preceding inflation analysis forecast.
Conclusion - UK Inflation Forecast 2009
The UK is heading for real deflation during 2009 as the below graph illustrates in that the RPI inflation measure is expected to go negative and spike lower around June / July 2009 as the RPI is sensitive to falling mortgage interest rates. The CPI will also continue to fall sharply into May 2009, which is targeting a rate of just below 1%. However the more money the government borrows as the difference between spending and tax revenues then the greater will be the eventual resulting inflation as there is no such thing as a free lunch, that will reverse many of the trends we have observed during the past 6 months and will continue to see during virtually all of 2009. However I am only expecting a mild up tick in inflation late 2009 due to the deflationary nature of economic contraction.
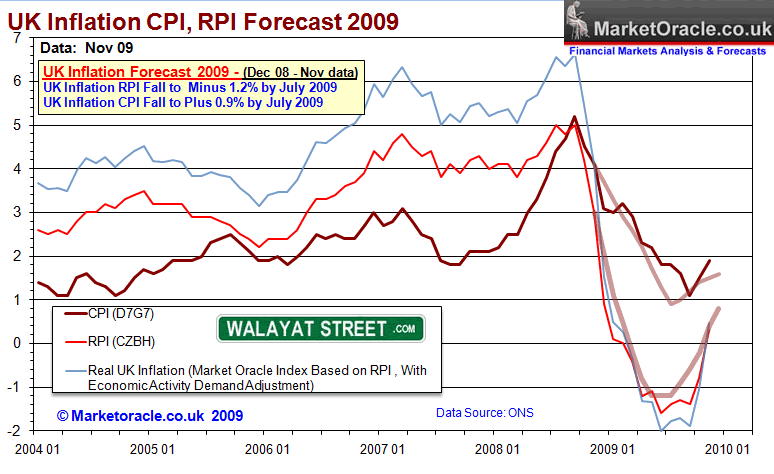
Therefore the conclusion is for UK inflation CPI to bottom at just below 1% by July 2009 and RPI inflation to bottom at -1.2% also by July 2009.
Risks to the Forecast - At this point the risks to the forecasts are more to the downside than the upside, meaning that inflation could spike still lower during mid 2009 than forecast above.
The Inflation Mega-trend
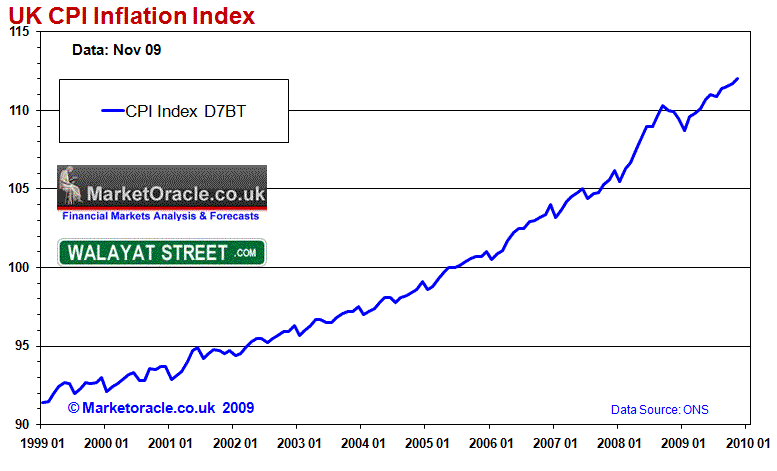
The UK Consumer Price Index (CPI) clearly illustrates that all we saw from mid 2008 and into early 2009 was a minor deflationary corrective wave amidst an ocean of year on year inflation. Subsequent inflation has far surpassed the in-consequential deflation seen during 2008 and into early 2009. Therefore the facts are completely contrary to the headline grabbing mainstream press and blogosphere scare mongering of price deflation.
There has been NO SIGNIFICANT DEFLATION, despite economic contraction of more than 5% GDP, despite Unemployment soaring to above 2.5 million, despite asset price destruction ranging from between 25% and 50% into the early 2009 lows. In fact the deflation that we witnessed is probably mostly due to the sharp drop in commodity prices such as Crude Oil's collapse from mid 2008 into early 2009.
My Inflation Mega-trend scenario analysis continues to conclude towards the Government and the Bank of England as with other central banks around the world mistakenly continuing to be fixated with fighting deflation whilst at the same time stoking the fires for a surge in inflation during 2010.
UK Retail Sales Signal Debt Fuelled Election Consumer Boom
The mainstream press and academic economists have been surprised by the most recent headline retail sales data that showed a decline of 0.3% against expectations of rise of 0.4% i.e.
BBC News 17th December - http://news.bbc.co.uk/1/hi/business/8417860.stm
UK retail sales fell in November, according to official figures, despite analysts' predictions of a rise.
The figures came as a surprise to many economists, who had hoped for consumer spending to fuel economic recovery.
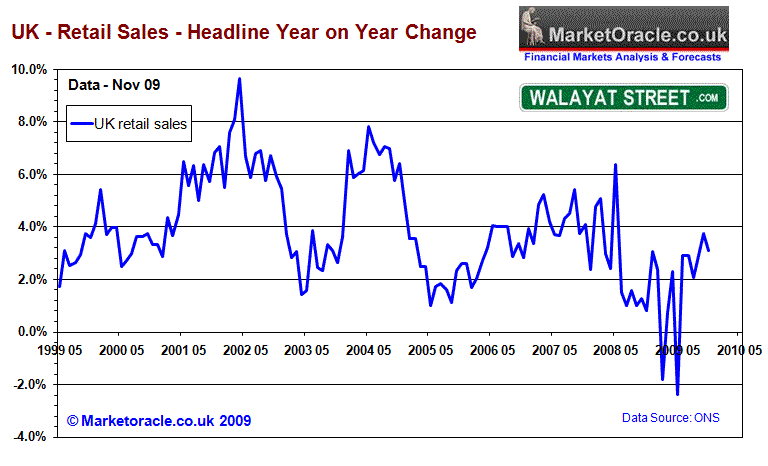
However I recognised the inaccuracy in the published retail sales data many years ago which prompted me to generate my own retail sales data which more accurately reflects the condition of the high street then the official data which typically results in a highly volatile retail sales series which feeds through into yo-yoing mainstream headlines which are in most cases contrary to what is actually taking place on Britians high streets as the below graph more clearly illustrates.
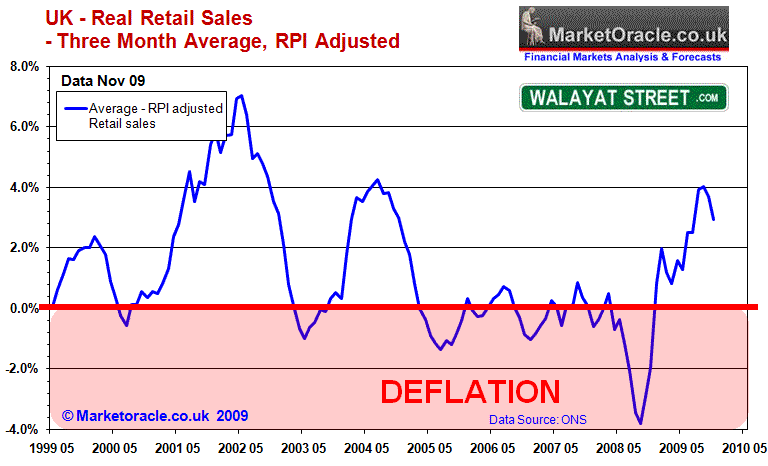
The adjusted retail sales data clearly shows that UK retail sales act as a leading indicator of economic activity and inflationary pressures of as long as 6 months. Retail sales led the price deflation into mid 2009, and now are again acting as a leading indicator for forward inflation and resurgent economic activity during the first half of 2010. The trend is extremely strong and continues to confirm the analysis of June 2009 that stated that Britain had embarked upon a debt fuelled economic recovery into a May 2010 General Election.
Very little of this strong retail sales trend is visible in any of the official or academic economic data that continues to look in the rear view mirror of what is "old news". The actual trend shows that the Labour party has succeeded in igniting a debt fuelled election consumer boom that will increasingly become apparent in mainstream press as we approach the May 2010 election deadline, but it is also indicative a steep upward curve in UK inflation and we are talking about inflation hitting the upper end of the Bank of England's 1% to 3% CPI Band during the first half of 2010 which politically suggests the UK General Election may take place much earlier than the consensus view for a May 2010 General Election, perhaps as early as mid February i.e. before the release of January inflation data.
M4 Money Supply Adjusted for the Velocity of Money
Whilst the mainstream press have been obsessed by headline M4 data throughout the past 12 months, however as I voiced in last years inflation analysis and forecast that the key to interpreting money supply data is to look at M4 adjusted for the velocity of money that implied imminent extreme deflation that has come to pass -
UK Money supply M4 (blue) has risen sharply from the 10% targeted low of mid 2008 to the current level of 16.6%, on face value this is highly inflationary and has been taken by many economists and market commentators to suggest much higher forward inflation. However the money supply adjusted for the velocity of money which takes into account the state of the economy as a consequence of the credit freeze tells a completely different story. The UK economy is now in extreme real monetary deflation of approaching -5%. The leading indicator of the implied money supply, is suggesting recent deep interest rate cuts of Novembers 1.5% and Decembers further 1% cut will lift future money supply growth out of extreme deflation, however it will still be far from supporting the levels north of 15% which accurately forecast forward inflation during 2008.
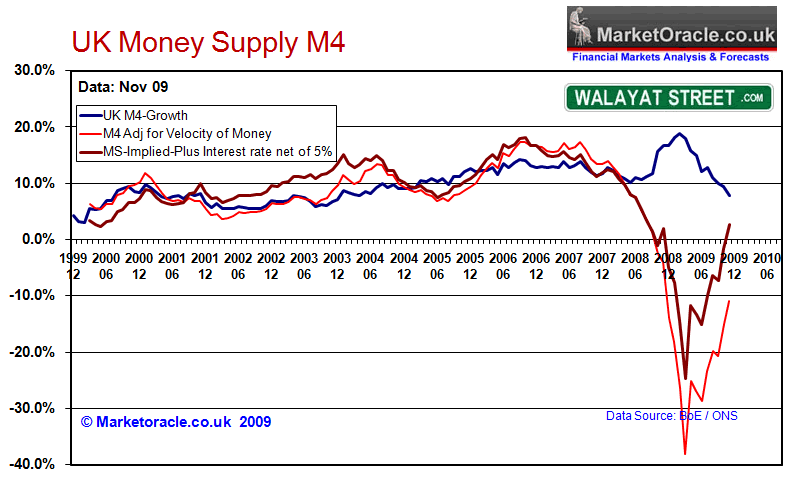
The M4 Graph shows opposing trends, it shows M4 falling from an extremely high level of near 20% that was jumped on earlier by the press to imply higher inflation, to now nudging below 10% to imply credit contraction deflation. However the real indicator of money supply shows the consequences of Quantitative Easing and near zero interest rates in that Money Supply adjusted for the velocity of money bottomed from a crash into March 2009, and it is only now that the money supply is breaking positive.
This suggests that the Bank of England and majority of economists remain mistakenly fixated on the headline M4 which has nudged below 10% and therefore continue with the policy of Zero Interest Rates and Quantitative Easing. What is remarkable in the most recent inflation data is the surge higher in both RPI and CPI (1.9%) despite weak money supply data, this strongly supports the view that the UK economy has drifted into a period of stagflation where models based on spare output capacity keeping inflation in check will fail ! I.e. we GET Inflation WITH spare capacity i.e. high unemployment, this is because the government is attempting to fill the output gap by increased public spending which is uncompetitive hence inflationary.
Therefore the expectations is for UK Money Supply adjusted for the velocity of money to continue surging higher and supportive of a strong trend higher in the RPI and CPI inflation indices that will leave the vast majority of the academic economists still mistakenly fixated on deflation scratching their heads.
I can easily see MS Implied surging higher to above 10% and M4 Adjusted passing above zero within the first quarter of 2010 on route to pre-credit crash levels during 2010, this also suggests a turnaround to some degree is also imminent in the M4 headline data.
UK Unemployment
The UK unemployment forecast as of October 2008 (July 08 data) forecast UK unemployment to hit 2.6 million by April 2010. The actual data to date of 2.49 million to Sept 2009 is inline with this trend, with unemployment benefit claimant count registering a small fall from 1582 to 1569 for November. The moderating unemployment data has surprised academic economists as it is much milder than their economic models suggest it should be by this point. However the data is strongly indicating to me of a strong STEALTH Economic Recovery underway which implies headline data is near an imminent peak and therefore should start to fall early 2010.
Academic economists have collectively converged during 2009 into the consensus 2009 that UK unemployment would soar to between 3 and 3.2 million by the time of the next general election (May 2010). Now with the slowdown of the unemployment growth in the face of a strong economic turnaround in the fourth quarter these same institutions will be busy revising forecasts for UK unemployment much lower in the coming months.
European Commission - May 2009 - It expects UK unemployment to rise to 9.4pc by 2010 leaving 3m workers jobless.
British Chambers of Commerce - April 2009 - Last month, data confirmed that the total number of people out of work surpassed the 2m mark in the three months to January, taking the official unemployment rate to 6.5pc – the highest since 1997. The BCC believes the total could hit 3.2m by the third quarter of next year.
Bank of England - Blanchflower - April 2009 - Warned unemployment was likely to top 3 million by the end of the year and there was a 'good chance it could go much higher still'.
CBI - Feb 2009 - The UK’s leading business group predicts the recession, which began in the third quarter of 2008, will last throughout 2009. The economy is expected to contract by 3.3 per cent and unemployment will reach close to 2.9 million by the end of the year.
I have long questioned the accuracy and validity of the official unemployment data which over several decades and much manipulation by successive governments has been tweaked many hundreds of time to under report true unemployment for political purposes. Current official unemployment stands at 2.49 million for September data release against which the total recorded as economically inactive of working age stands at 7.99 million which in my opinion is reflective of the true rate of unemployment as the below graphs illustrate.
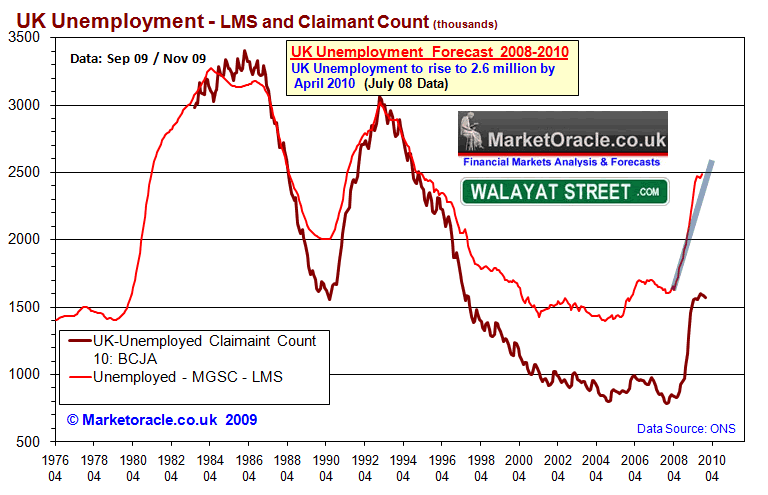
The real unemployment trend clearly shows a sideways trend channel of between 8 million and 7.8 million, Having hit the upper channel it is now strongly suggestive of having peaked and targeting a trend back towards the lower end of the channel i.e. projecting towards a decline of 200,000 during 2010.
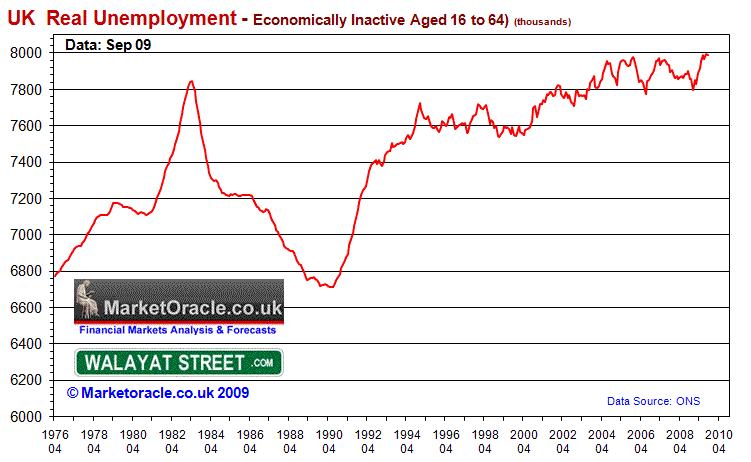
In conclusion the headline UK unemployment rate of 2.49 million is just a stone throw away from the 2.6 million target which suggests little upside momentum left in the unemployment data and therefore indicative of an imminent peak and decline unemployment statistics to be announced during Q1 2010, which therefore confirms my view of a much stronger than expected economic recovery and therefore has much higher inflationary implications as well as political implications of improving Labours election prospects.
Debt Fuelled Economic Recovery Heading for Double Dip Recession?
UK GDP for the 3rd Quarter was revised marginally higher to minus 0.2% from the earlier ONS estimate of minus 0.3%. The year has witnessed 'think tanks' and academic institutions flailing in all directions as optimistic forecasts of earlier in the year proceeded to be continuously revised lower in terms of economic contraction and then by late summer in advance of third quarter GDP data starting to anticipate an economic recovery in the third quarter with consensus for a 0.3% growth which failed to materialise.
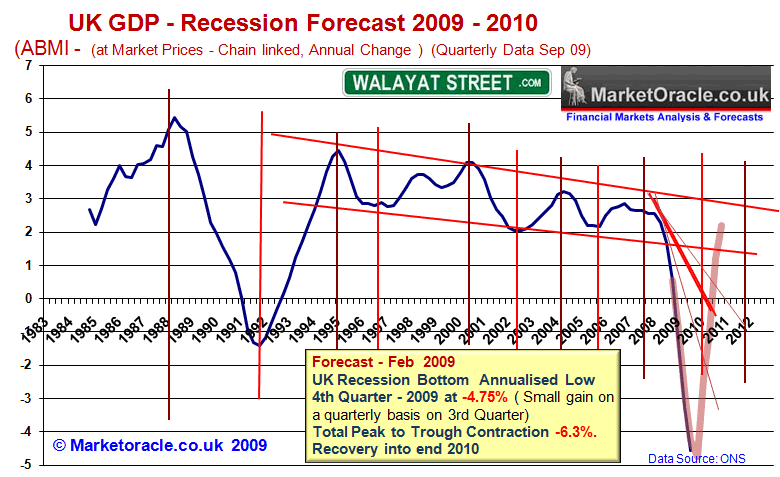
The GDP trend for the UK economy has been accurately mapped out in the in depth analysis and forecast of 17th February 2009 (UK Recession Watch- Britain's Great Depression?), that both called for severe peak to trough economic contraction of -6.3% at a time when the likes of the UK Treasury were forecasting contraction of less than half at -3%. The analysis also concluded in a strong debt fuelled economic recovery during 2010 to coincide with a summer 2010 General Election. As of the revised ONS GDP data (ABMI Chain linked at Market Prices) total peak to trough contraction is now 6.23% virtually exactly inline with the forecast for -6.3%. Annualised contraction for the third quarter is at -4.56% with trend on target for -4.75% for the fourth quarter.
The UK economy remains on track to bounce back strongly during 2010, as indicated by June's in depth analysis, however this economic recovery is based largely on debt as shown by the graph below, as the Labour government's strategy is to deliver the next Conservative government a scorched earth economy.
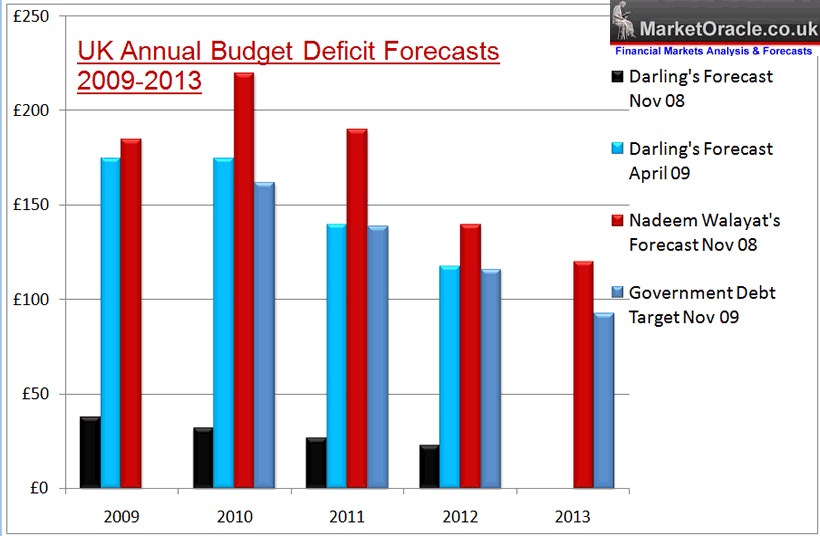
Alistair Darling's forecast for government net borrowing for 2009 and 2010 in November 2008 totaled just £70 billion. However, since the amount of projected borrowing has mushroomed to £350 billion, which is set against my November forecast of £405 billion for 2009 and 2010 alone, with continuing subsequent large budget deficits thereafter of well above £100 billion a year.
Whilst many economists were surprised by Alistair Darling's April forecast that the UK Economy would grow by 1.25% in 2010 and 3.5% in 2011. However we need to consider the following in that 1.25% growth on the annual GDP of £1.2 trillion equates to growth of just £15 billion and for 2011; 3.5% growth equates to just £42 billion. Therefore the government is borrowing a net £175 billion for 2009 and £175 billion for 2010 to generate £15 billion of growth, and then a further £140 billion for 2011 for £42 billion of growth. Thus total net borrowing of £490 billion to grow the economy by just £67 billion, (£595 billion my forecast) which shows the magnitude of the scorched earth economic policy now implemented that literally aims to hand the next Conservative government a bankrupted economy that will be lumbered with the consequences of continuing huge budget deficits and therefore deep cuts in public spending.
Debt and Liabilities
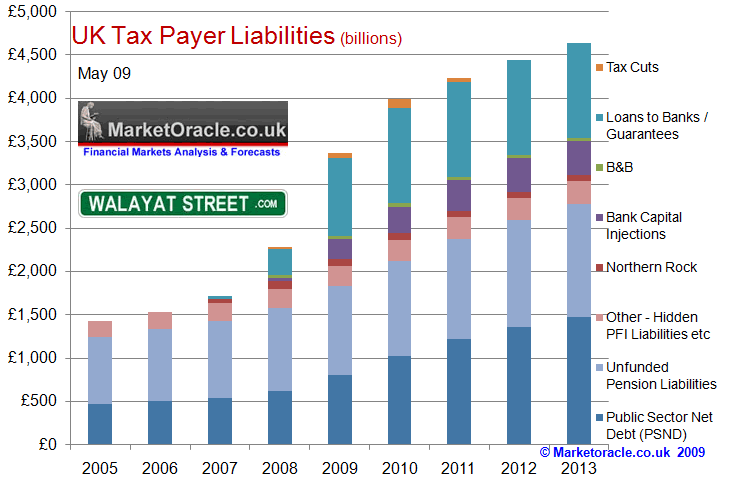
The total liabilities as a consequence of bailing out the bankrupt banks and debt fuelled economic recovery remains on target of £4.75 trillion by the end of 2013/14, which confirms my view that to cope with the debt burden the bank of England will have to keep monetizing government debt which puts Britain on the path towards many years of stagflation, which my UK GDP forecast will next cover in greater depth.
Meanwhile the Bank of England remains skeptical of a UK economic recovery during 2010 as the Guardian reports on 23rd December-
The Bank of England is leaving the door open to a new year £200bn money expansion programme after revealing that it remains unconvinced about the economy's ability to emerge from the deepest and longest recession on record.
"Jonathan Loynes, chief European economist at Capital Economics, said: "We continue to expect interest rates to remain at their current level until the end of 2010, if not considerably longer."
Whilst I agree that the bank of England will continue to monetize debt, however my economic analysis is concluding towards a strong bounce back and hence the Bank of England's policy of further QE ensures that the inflation flames are being stoked higher, which suggests above trend inflation and growth rates.
UK Interest Rate Being Kept Artificially Low For Bank Profiteering
The UK interest rate forecast of early December 2008 for 2009 forecast that UK interest rates should decline to 1% (from 3%) by early 2009 and remain there into the second half of 2009. However following the cut to 0.5% in March 2009, the Bank of England has continued to pursue an artificial banking system by keeping interest rates at an extreme historic low of just 0.5% into the end of 2009 so as to flood the bankrupt banks with liquidity to enable them to rebuild their balance sheets by overcharging customers against the base interest rate and manipulated interbank market rate of 0.66% against rising real market interest rates which have been in a steady climb since March 2009 which increasingly means that the base interest rate has become irrelevant to the retail market place as explained in the article - Bailed Out Banks Not Lending, Sitting on Tax Payers Cash.
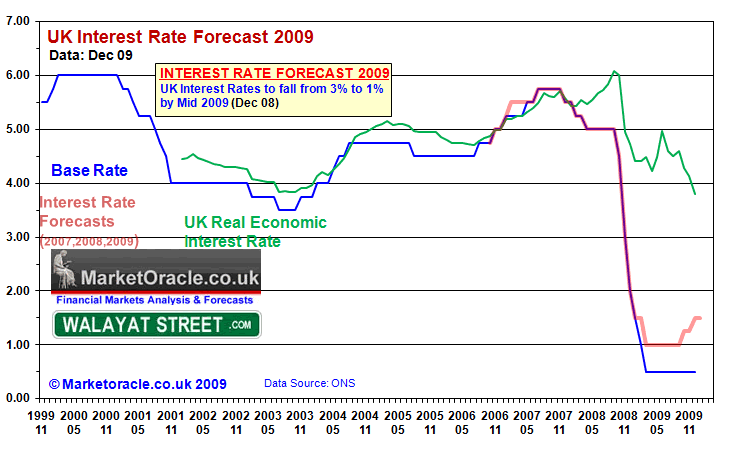
The artificial banking system means that the bill for low interest rates is being paid by Savers who along with all tax payers are being forced to pay for the bankster's crimes as tax payer bailed out banks such as HBOS pay a pittance on instant access savings accounts of as little as 0.1% against a requirement of 2.3% just to cover CPI inflation of 1.9% plus the 20% tax charged on interest.
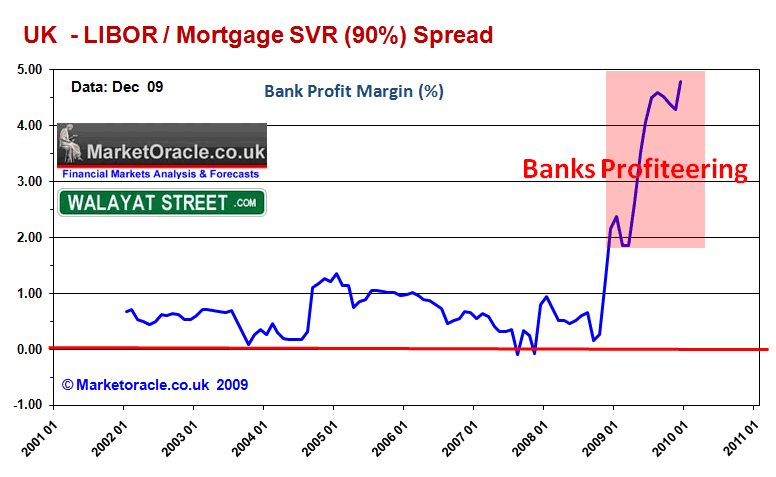
Money is being sucked out of the pockets of savers and being deposited onto the balance sheet of bailed out banks that have no incentive to pay a decent rate of interest when they can borrow at 0.5% from the Bank of England and marginally higher from other UK banks. The artificial banking system is resulting in unprecedented huge profit margins for the banks as market interest rates charged to retail customers continue to rise regardless of the base rate being held at 0.5% well into 2010 which is inflationary in terms of rising mortgage and other debt interest costs as these rising costs will show up to varying degrees in the RPI and CPI inflation indices. I will cover the UK interest rate forecast for 2010 in-depth in the coming week.
UK House Prices Continue 2010 Government Debt Fuelled Election Bounce
The UK housing market bottomed in March / April 2008 which was recognised in the May analysis and has since continued the debt fuelled bounce as a consequence of money printing and zero interest rates as the Labour government has succeeded in inflation the UK economy out of recession in time for an early 2010 General Election.
As is the case with virtually all market junctures, back in March if this year the Telegraph and other mainstream media ran with a scare story that UK house prices could crash by a FURTHER 55%, this was after UK house prices had already fallen by 22% and whilst house prices had yet to bottom the Telegraph story at the time seemed to be a completely ridiculous scare mongering purely for the purpose of sensational headline grabbing rather than presenting something that their readership could utilise to their advantage.
12th March 2009 - Telegraph Runs with Improbable UK House Price Crash Forecast of Another 55%
The mainstream press as illustrated by The Telegraph has run with a house price forecast by Numis Securities (NS) that states that UK house prices could fall by a further whopping 55%, that is a rather incredible forecast to make in light of the of 22% fall to date. NS states that a buy to let investor panic will trigger an avalanche of further selling. I am not aware of Numis Securities past forecasts, however analysis of the perma-bear Capital Economics that has consistently been cropping up with bearish house price forecasts since at least 2002 in the mainstream media illustrated the propensity to reprint press releases with-out checking the facts as to whether the forecast is actually probable or not.
The Telegraph wrote: House prices 'could fall by further 55 per cent
"People who bought buy-to-let flats are expected to “begin panic selling” and the average home value could drop below £100,000."
“Despite UK house prices already having fallen 21% from the peak, we do not believe that the correction is anywhere near over.
“Our core headline forecast is that UK property prices remain between 17% and 39% overvalued based on fair valuation. Moreover, history has shown us that when property…which has experienced a price bubble corrects, the price tends to fall below fair value for a period of time, as confidence in that market remains low. Prices could fall a further 40-55% if the over-correction was as bad as the early 1990s in our view.”
Subsequently, UK house prices bottomed in April / May 2009 and have embarked upon a debt fuelled bounce into a May 2010 General Election that has already seen UK house prices RISE by more than 5% from the April / May low rather than to CRASH toward another 55% drop.
Whilst many are focused on the headline unemployment data, however back in August 2009 in the analysis (UK House Prices Tracking Claimant Count Rather than Unemployment Numbers), the conclusion was that the focus should remain on claimant count rather then the headline unemployment rate, in this regard the claimant count is turning positive in the most recent data and is therefore supportive of a continuation of the trend higher in UK house prices.
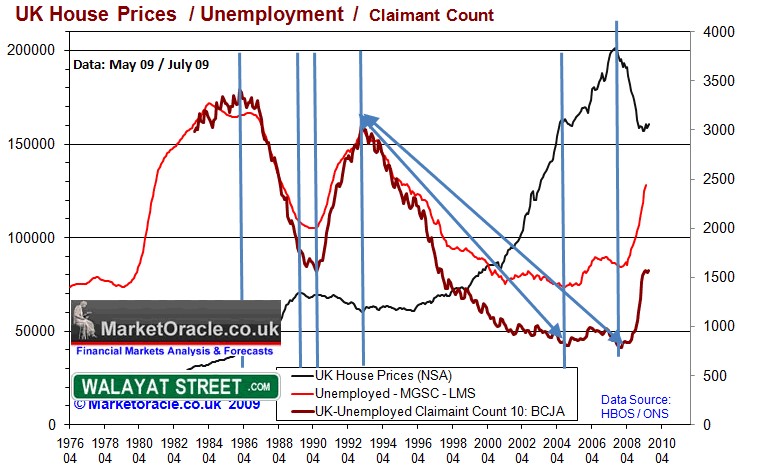
The above chart indicates that there does exist a strong relationship between house price trends and the unemployment benefit claimant count, more so than the unemployment data. The possible reason for this is that those made unemployed that do not claim benefits are not in as financially distressed state than those that have no choice but to claim benefits, therefore house prices can and have risen in the past whilst the official rate of unemployment rose, if at the same time the claimant count did not rise.
The recent bounce in house prices is tracking quite closely with the stabilisation of the unemployment claimant count numbers, which therefore suggests that as long as those claiming unemployment benefits continues to stabilise at the current level of 1.6 million then the outlook remains positive for UK house prices to continue drifting higher, this is despite official unemployment data that looks set to continue to rise towards 3 million from 2.43 million.
My on going research suggests that the debt fuelled economic recovery is expected to continue into mid 2010 that could see house prices up by as much as 10% year on year and therefore contrary to the widespread view of flat house prices during 2010, however this warrants in depth analysis to formulate a higher probability forecast which I aim to complete during January 2010.
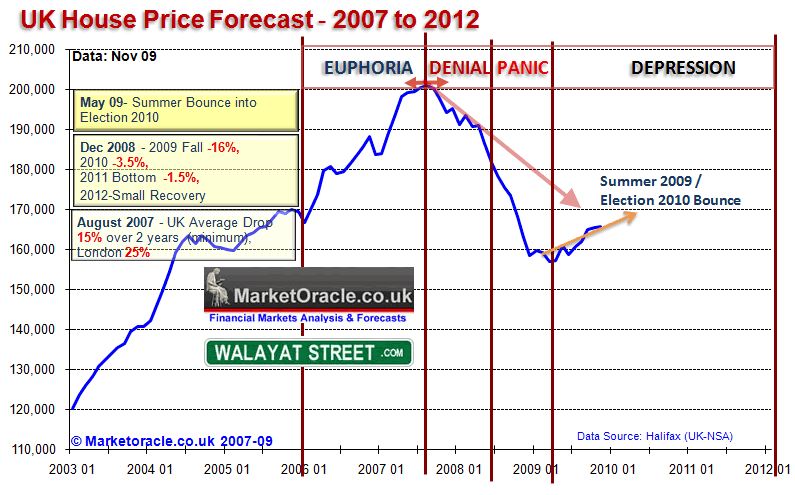
In conclusion the trend of inflating UK house prices into mid 2010 is supportive of the trend of inflating general prices that will play catch up during early 2010 and continue upward into the second half of 2010 due to increased consumer spending as a consequence of some of the return of the feel good factor amongst consumers.
UK Producer Prices
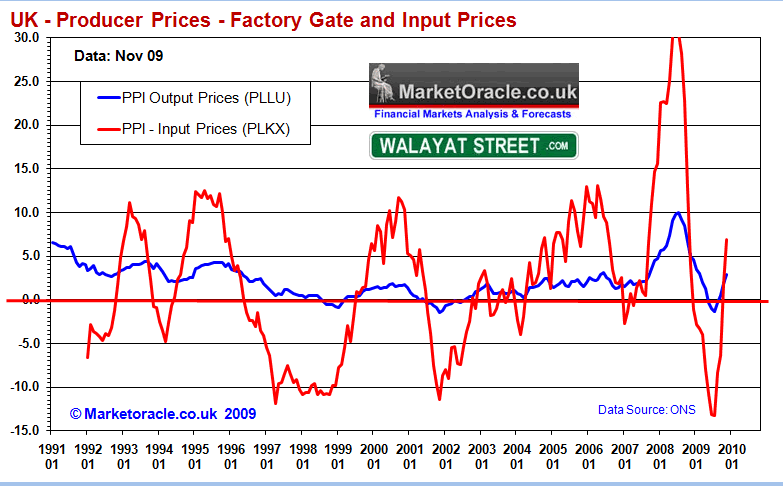
Producer Input and Output prices bottomed in June 2009 and have bounced strongly from deflation back into inflation. The trends again act as a leading indicator for consumer prices that lag by a couple of months or so. The momentum behind the recovery in producer prices is suggestive of a trend towards extremes in the coming months i.e. PPI Output to above 10% and PPI Input to more than 5%, both of which suggest that the imminent spike higher to follow in retail and consumer prices towards the upper bands will be sustained into at least mid 2010.
Stocks Bull Market Signaling Strong Economy
The stocks stealth bull market of 2009 has been one of the greatest bull market rallies in history and for its duration has been explained away by academic analysts as an aberration, a bear market rally who's demise was always imminent that illustrates the difference between theory produced in ivory towers for the primary purpose of gaining letters after ones name than to actually attempt to monetize on probable trends as the consequences of being wrong for the latter is loss of real money. The fact is simple, the stocks bull market of 2009 is by far the strongest indicator of a strong economic recovery than anything seen in any economic data that academic economists and even many market analysts / mainstream press commentators pursue with a vigour whilst ignoring the biggest indicator of all that is staring them right in the face. The birth of the bull market right from early March has increasingly indicated to me that we are heading for much stronger economic activity during 2010 and therefore much higher inflation.
British Pound to Wobble Lower During 2010
The existing U.S. Dollar bull market scenario analysis calls for the Dollar to rally towards a target of 84, with the initial buy trigger of 77.00 achieved during the past few days this now sets the scene for sterling weakness against the Dollar, which has already seen the GBP nose dive from £/$1.68 to below £/$1.60. A U.S. Dollar index rally to 84 would coincide with a drop in sterling to below £/$ 1.50, therefore presents a bearish starting point for chart analysis.
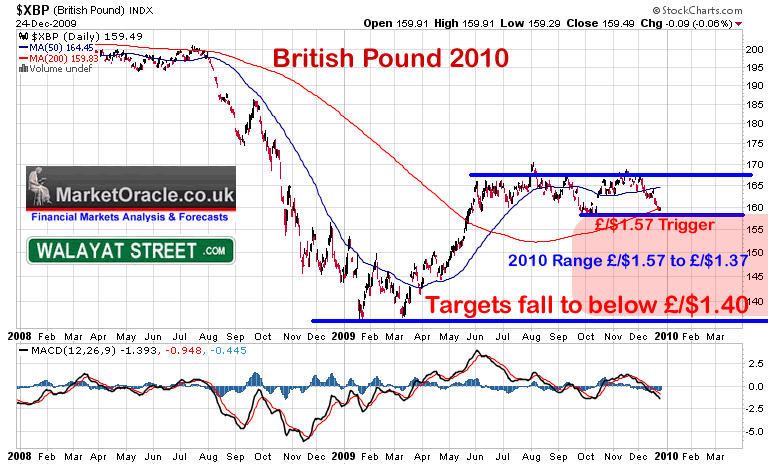
Two items stand out from the GBP chart:
1. That sterling is targeting immediate support at £/$1.57 which implies it may temporarily bounce from there back through £/$1.60 before the eventual break.
2. That a break below £/$1.57 would target a trend to below £/$1.40.
On a longer term view, the chart is indicative of trading range between £/$1.57 and £/$1.37, on anticipation of the eventual break of £/$1.57. On average this implies a 10% sterling deprecation against the trend of the preceding 6 months or so. I expect sterling to fall against other major currencies such as the Euro where it targets a drop of 10% or so from the current 1.12.
What could drive sterling lower during 2010 apart form Dollar strength ?
The obvious thing that comes to mind is the Bank of England keeping UK base interest rates artificially low (UK interest rate forecast for 2010 will follow in the coming week- newsletter) whilst the economy recovers, inflation rises and the trade gap widens, therefore this WILL impact on the currency and result in relative weakness as commodities such as crude oil are priced in dollars and thus will result in an inflationary feed back loop. Neither is the currency helped by open ended money printing to monetize the huge amount of government debt issuance as a consequence of a 12%+ budget deficit.
Conclusion and UK CPI Inflation Forecast 2010
The sum of the above and recent analysis is for UK inflation to spike higher in the coming months during early 2010. This is inline with my view that the Labour government has succeeded in sparking a strong debt fuelled economic recovery that will become clearly visible during the first quarter of 2010. I expect UK inflation as measured by CPI to break above the Bank of England's upper CPI target of 3% very early in the year, and stay above 3% for most of the year only coming back below 3% late 2010 as a consequence of the next governments attempts to bring the unsustainable budget deficit under control.
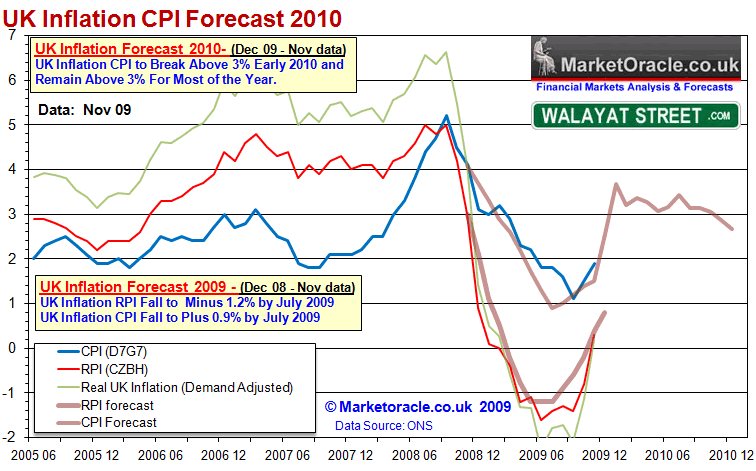
My next analysis in this series will cover the UK economy and then UK interest rate projections for 2010 all of which will culminate in the Inflation Mega-trend ebook that I intend on completing and make available for free within the next 2 weeks. Ensure you are subscribed to my always free newsletter to get this analysis that money cannot buy in your email in box.
Risks to the Inflation Forecast
The obvious risk is of the collapse of another major financial institution triggering a deflationary financial armageddon, though the risks of this are now infinitely smaller for 2010 then they were in the lead up to the Lehman Bankruptcy. The real risk is of countries imploding but whilst this would hit the economies however the consequences of imploding countries is inflationary rather than deflationary as panicking governments with citizens rioting in the streets tend to ramp up the printing presses to full steam and similarly induce a collective panic amongst other central bankster's to do likewise, therefore this suggests to me that the actual risk to the forecast is more to the upside then the downside, though yes government debt defaults will not look pretty in the financial markets which like 2008 would induce extreme market volatility.
Implications of the Inflationary Surge
Greater depth and scope of implications will be covered in the Free Ebook that I aim to complete by the end of December. (free newsletter)
UK General Election 2010 - Expect the public and press to be surprised during the next few months as the UK economy bounces back strongly in the first quarter. For all of Gordon Browns many faults, and whether or not he actually wins what is likely is a much tighter election campaign as the polls narrow, Gordon Brown HAS succeeded in delivering a Strong Election Bounce for the Labour party into mid 2010. I will have to probably revise my UK election forecast as of June 2009 during January 2010 that projected Conservatives on 343 seats, Labour 225 and Lib Dems on 40.
Inflation / Deflation Debate - I increasingly recognised the imminent return of Inflation by mid November 2009 that resulted in the article Deflationists Are WRONG, Prepare for the INFLATION Mega-Trend. I expect so will many presently fence sitting analysts and economists during early 2010 in the face of visibly rising inflation in the various inflation indices across the world, which only leaves the perma-deflationist behind who will continue to mistakenly cling on to a non existant deflationary argument as a consequence of the deleveraging deflationary corrective wave of 2008 into early 2009 amidst an ocean of inflation as my earlier article illustrated.
UK Interest Rates - Will the Bank of England be able to keep UK interest rates artificially low during 2010 ? More on this in the coming week in my UK interest rate forecast, but what I will say is that the market interest rates WILL continue to rise, so good news for savers, but bad news for borrowers.
UK Government Bonds - 2010 will be the year Quantitative Easing debt monetization does Battle with the forces of Rising Inflation and Market Interest Rates, the crunch point will culminate in a sharp drop in sterling (10%) as the market wins as bond Investors demand higher yields for UK Junk Government Bonds.
Stock Market - Will the stealth bull market continue during 2010 ? I don't see why not, at least into mid 2010 but this does demand in-depth analysis that will follow during January as the deliciously and excruciatingly impressive 60% gains off of the March lows on face value imply 2010 will not be such an easy free central bank liquidity driven lunch for stocks bull market trend monetizing investors as inept central bankers increasingly start to hit the panic buttons in the face of rising inflation.
Source and Add Comments Here - http://www.marketoracle.co.uk/Article16085.html
By Nadeem Walayat
http://www.marketoracle.co.uk
Copyright © 2005-09 Marketoracle.co.uk (Market Oracle Ltd). All rights reserved.
Nadeem Walayat has over 20 years experience of trading derivatives, portfolio management and analysing the financial markets, including one of few who both anticipated and Beat the 1987 Crash. Nadeem's forward looking analysis specialises on the housing market and interest rates. Nadeem is the Editor of The Market Oracle, a FREE Daily Financial Markets Analysis & Forecasting online publication. We present in-depth analysis from over 500 experienced analysts on a range of views of the probable direction of the financial markets. Thus enabling our readers to arrive at an informed opinion on future market direction. http://www.marketoracle.co.uk
Disclaimer: The above is a matter of opinion provided for general information purposes only and is not intended as investment advice. Information and analysis above are derived from sources and utilising methods believed to be reliable, but we cannot accept responsibility for any trading losses you may incur as a result of this analysis. Individuals should consult with their personal financial advisors before engaging in any trading activities.
Nadeem Walayat Archive |
© 2005-2022 http://www.MarketOracle.co.uk - The Market Oracle is a FREE Daily Financial Markets Analysis & Forecasting online publication.
Comments
|
Phil Moore
28 Dec 09, 00:23 |
Uk interest rates
Great work Nadeem! I have a fixed savings bond maturing in January and do hope your interest rate forecast will include advice on what savers should do during 2010. PM. |
|
Chad C
28 Dec 09, 06:22 |
UK Interest Rates
Phil, Buy physical gold and silver. The paper ponzi scheme will soon be realized as the US defaults on it's Treasuries/Bonds by 2012. This will cause a tidal wave of inflation and a bond market/currency collapse that will rip through Europe. |
|
Nadeem_Walayat
18 Jun 10, 16:12 |
Inflation Mega-Trend Continues With UK CPI 3.4%, RPI 5.1%
 Another month and another release of UK inflation data at far above the Bank of England's target of 2% and above the upper limit of the Banks 1% to 3% range by reporting CPI of +3.4% for May. Thus the BoE Governor, Mervyn King will write another letter to repeat that the high rate of inflation is just "temporary", though when does "temporary" high inflation stop being temporary? 6 months? a year? 2 years? as the country sleep walks into stagflation with all of the consequences for wage earners and savers. Another month and another release of UK inflation data at far above the Bank of England's target of 2% and above the upper limit of the Banks 1% to 3% range by reporting CPI of +3.4% for May. Thus the BoE Governor, Mervyn King will write another letter to repeat that the high rate of inflation is just "temporary", though when does "temporary" high inflation stop being temporary? 6 months? a year? 2 years? as the country sleep walks into stagflation with all of the consequences for wage earners and savers.
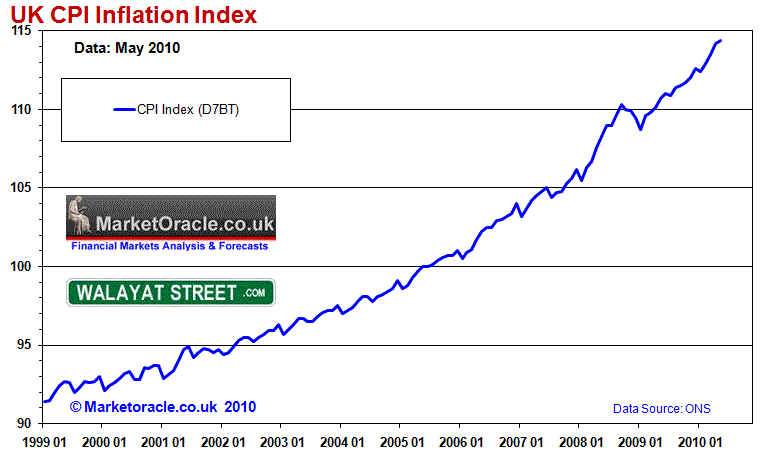
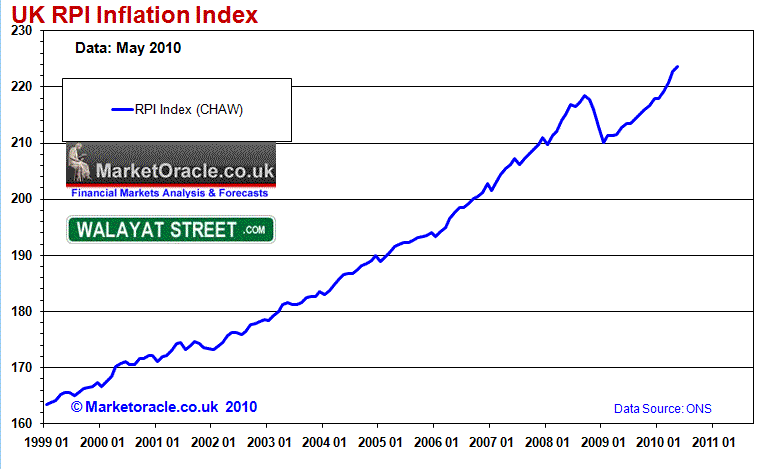
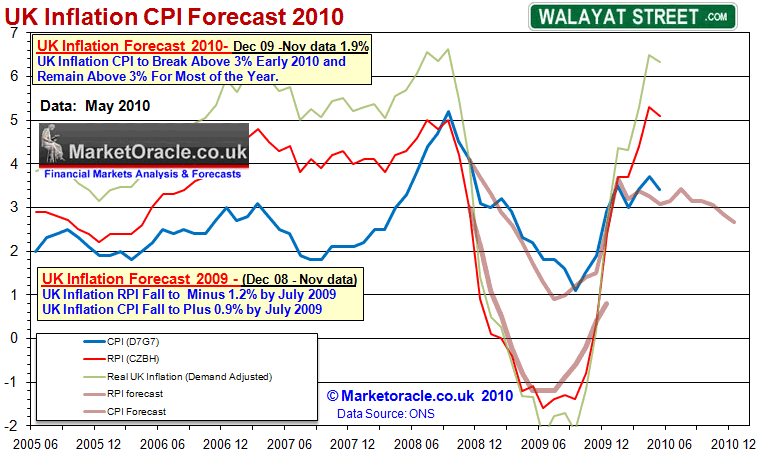
Meanwhile the real rate of UK inflation as measured by the publically more recognised RPI index remains even higher at 5.1%, which after stripping out the effects of manipulated low interest rates as a consequence of Quantitative Easing and other direct interventions to support the Housing Market such as the funneling of tax payer cash onto bailed out banks balance sheets leaves the RPIX also at 5.1% which better reflects actual UK consumer price inflation experience and is set against my own real UK inflation tracker that stands at 6.3%. UK Inflation Forecast 2010 UK Inflation of CPI at 3.4% for May is remarkably close to my trend forecast for 2010 as of December 2009 that projected May data of 3.1%. My analysis since November has been warning of a spike in UK inflation as part of an anticipated inflation mega-trend (18 Nov 2009 - Deflationists Are WRONG, Prepare for the INFLATION Mega-Trend ) that culminated in the forecast of 27th December 2009 (UK CPI Inflation Forecast 2010, Imminent and Sustained Spike Above 3%) and the Inflation Mega-trend Ebook of January 2010 (FREE DOWNLOAD) as illustrated by the below graph.
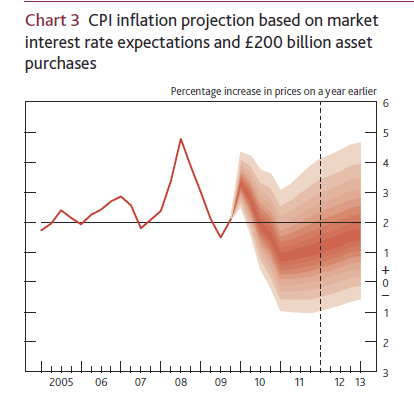
According to the Bank of England's forecast for UK inflation of just over a year ago (Feb 2009) - May 2010 CPI Inflation should by now be at 0.9%, instead of the actual rate of 3.4%. Whilst the more recent Bank of England Inflation Report (Feb 2010) of barely 4 months ago forecast that UK inflation by May should have fallen to about 2.3%, instead it is at 3.4% (see graph). Therefore how credible are the Bank of England's persistent claims that the ongoing rise in UK inflation is "temporary" and that it is forecast to fall to UNDER 1% by the end of 2010 (Feb 2010) ? The Bank of England has a track record of being wrong 96% of the time in its inflation forecasts of where inflation will actually be in 2 years time, as the usual mantra is for UK inflation to magically converge to 2% in 2 years time, much as the graph on the right concludes towards. VAT 20% Inflation Surge Time Bomb Whilst the trend in UK CPI continues inline with expectations however the New Con-Dem government is expected to detonate the VAT Hike inflationary Bomb that will likely result in an surge higher in Inflation to above 4% CPI and 6% RPI following next weeks emergency budget on 22nd June 2010, as I wrote of during the election campaign (05 May 2010 - Greece Economic Depression Resulting in INFLATION NOT DEFLATION Surge ) A post UK election VAT hike to 20% from 17.5% is near certain to bring in extra revenue of about £13 billion per year. This will have the effect of both spiking inflation sharply higher and maintaining the ongoing longer-term inflationary mega-trend, therefore I would not be surprised that following the implementation of a VAT tax hike that CPI spikes above 4% and RPI as high as 6%! Which would further discredit the Bank of England's mantra of "Don't Worry Folks its Only Temporary". I wonder how many ordinary UK citizens will believe the Bank of England's statements of temporary inflation when they see Inflation of CPI 4%+ and RPI 6% following the VAT hike. Will they still be willing to accept wage hikes of 2% or less, or will they start to demand ever higher wage rises to match surging inflation and hence feed the the wage price spiral. Therefore my growing expectations are for the actual trend in UK inflation to continue to materialise to the upside of the forecast for 2010, with a continuation of high UK inflationary trend well into 2011, with an in depth forecast for 2011 to follow before the end of 2010. Inflation Is a Government Stealth Tax On / Theft From Savers and Workers Whilst Mervyn King writes another letter full of repetitive excuses as to why the Bank of England cannot do its job. The price is being paid for by ordinary savers and workers who are in effect being robbed by the banks and the government as inflation is a stealth tax on savers and earners that seeks to stealthily destroy the real value of accumulated life time savings and erode the real purchasing power of earnings. Add to this that savings are TAXED at 20% then savers should be enraged and demonstrating in the streets as to why they are receiving a pittance of interest rates at just 2% on even the top ranked savings accounts when inflation as measured by RPI is at 5.1%, and when tax is taken into account savings interest rates would need to be at 6.1% JUST to break even against inflation. So basically the Government, Bank of England in collusion with the bankster's are STEALING more than 60% of the earnings capacity of savings and therefore theft of the real capital value. Readers don't be under any illusion, the Bank of England has lost control of inflation as the normal response to high inflation is to raise interest rates, instead of a UK base rate of 0.5% it should be at 4.5%. The reason why rates remain at 0.5% is as part of the process of transferring bankrupt bank debts off the bank balance sheets and onto the tax payers, that's you the tax payer who is picking up the tab by taking on the liabilities and debts of the bankrupt banking sector, which STILL more or less remains BANKRUPT, that only survives as a consequence of government support by means printing money and keeping interest rates at 0.5%. This means that savers and wage earners are being forced to a. subsidise the bankrupt banking sector and b. finance the governments budget deficit and total growing debt mountain by means of the stealth tax called INFLATION, which seeks to eat away the value of the total debt, as elaborated at length in the Inflation Mega-Trend Ebook (FREE DOWNLOAD) The Deflationary Pseudo Economists If you read much of the mainstream press that tends to buy the Bank of England's monthly litany of excuses, you may get the impression that there is a tug of war going on between inflation and deflation, with the outcome yet to be decided. This despite the fact that CPI inflation is at 3.4% and RPI at 5.1%, i.e. some distance from zero. The reality of the situation remains in that the worlds economies swim in an ocean of inflation with the occasional ripples of deflation on its surface, as the following graphs illustrate that the pseudo economists with their persistence deflation clearly only see the deflationary ripples whilst missing the deep inflationary ocean.
The above CPI and RPI Index graphs clearly show there IS NO DEFLATION! As Deflation in our money printing fiat currency bankster run fraudulent financial system can only exist fleetingly as a mere ripple on the surface that is utilised by the vested interests in the Inflation Mega-trend to ensure further inflationary money printing policies are always enacted by governments so as to STEALTHLY Steal the wealth and earnings purchasing power of ordinary people who are gradually FORCED into becoming debt slaves in an attempt to maintain falling standards of living. Protect Your Savings and Wealth The Inflation Mega-Trend Ebook (FREE DOWNLOAD) covers at length the whole on going theft of value of savings and wage purchasing power, but more importantly contains 50 pages of what people can do to protect their wealth. If you keep your money in the bank or building society then you are letting the bankster's gradually steal the value of your savings as the rate of return to beat CPI inflation and the 20% savings tax will need to be about 4.3%, instead the banking sector typically offers depositors less than 2% for instant access accounts and less than 2.75% for 1 year fixes. The easiest and safest way for investors to protect themselves immediately is ironically a government backed product, the National Savings Index Linked certificates that pay 1%+ RPI Inflation that's 1% Plus 5.1% if inflation remains at 5.1% for the next 12 months. The actual formula is based on the RPI indices at anniversary against where it stood at the time of Purchase. More advanced mechanisms for protecting your wealth such as investing in safe big cap cap dividend paying stocks, commodities such as oil and gold and silver and wheat which is particularly cheap at the moment, and other fiat currencies that are expected to appreciate in the long-run such as the Chinese Yuan, Aussie Dollar are covered at length in the Inflation Mega-Trend Ebook. Bottom Line - You NEED to protect your wealth from the government and the Bank of England that will seek to steal the value of your wealth and earnings by means of INFLATION. The government has no choice but to print money and monetize debt, it HAS NO CHOICE. There is no other way out, yes there will be the occasional deflationary ripples but the worlds economies swim in an ocean of inflation as evidenced by the RPI and CPI Inflation indices which ensure the Inflation Mega-Trend will run not for months, or even years but decades! Nadeem Walayat |
|
mariya
30 Aug 10, 16:05 |
inflation
The government calculates this to one decimal place. So the typical annual inflation rate would be something like 2.5%. |
|
Sara
30 Nov 10, 16:24 |
Hedge against inflation - Buy gold, silver, and platinum
The deflationary spiral is caused by wealth being wiped out by the stock market crash and high unemployment. Because the world governments are printing money like crazy, once unemployment is under control, monetary inflation and worldwide currency devaulation will kick in. Central Banks of China and India are already hoarding millions of pounds of gold as stores of value. The Euro and the dollar are in an imminent crisis as they lose value every day. Here is a good article on why printing of money by a misbehaving government causes currency devaluation and how to protect oneself against inflation. Buying physical gold, silver, and platinum looks better than ever. |


 Bank of England's Worthless Inflation Forecasts