UK Retail Sales Signal Debt Fuelled Election Consumer Boom
Economics / Economic Recovery Dec 25, 2009 - 12:01 AM GMTBy: Nadeem_Walayat
 This is the next in a series of analysis as part of my unfolding inflationary mega-trend scenario towards the formulation of an inflation forecast for 2010 and beyond. I aim to complete the whole scenario including interest rates, economy and implications of before the end of December which will be published as an ebook that I will make available for FREE. Ensure you are subscribed to my always free newsletter to get the latest analysis in your email box and check my most recent analysis on the probable inflation mega-trend at http://www.walayatstreet.com
UK Retail Sales Signal Debt Fuelled Consumer Boom
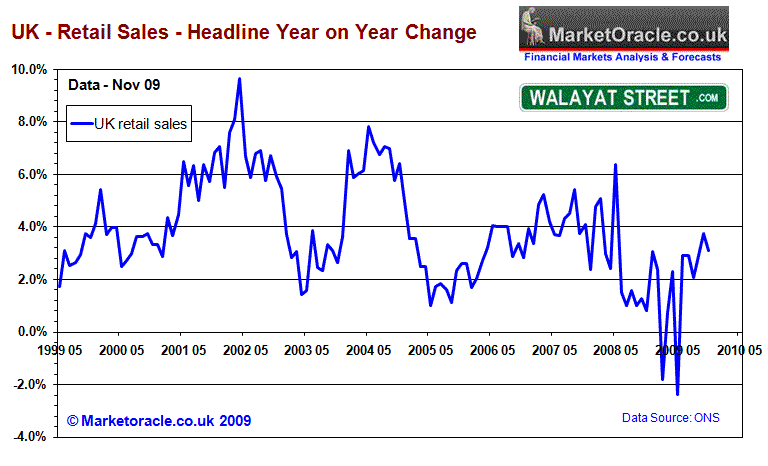
The mainstream press and academic economists have been surprised by the most recent headline retail sales data that showed a decline of 0.3% against expectations of rise of 0.4% i.e.
BBC News 17th December - http://news.bbc.co.uk/1/hi/business/8417860.stm
UK retail sales fell in November, according to official figures, despite analysts' predictions of a rise.
The figures came as a surprise to many economists, who had hoped for consumer spending to fuel economic recovery.

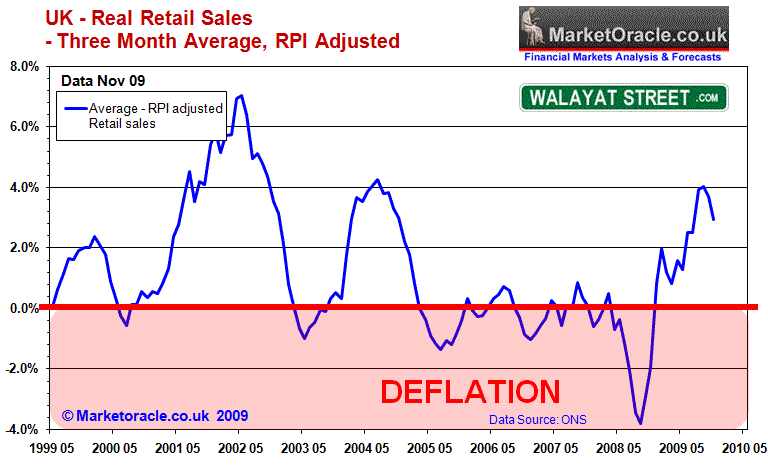
However I recognised the inaccuracy in the published retail sales data many years ago which prompted me to generate my own retail sales data which more accurately reflects the condition of the high street then the official data which typically results in a highly volatile retail sales series which feeds through into yo-yoing mainstream headlines which are in most cases contrary to what is actually taking place on Britians high streets as the below graph more clearly illustrates.

The adjusted retail sales data clearly shows that UK retail sales act as a leading indicator of economic activity and inflationary pressures of as long as 6 months. Retail sales led the price deflation into mid 2009, and now are again acting as a leading indicator for forward inflation and resurgent economic activity during the first half of 2010. The trend is extremely strong and continues to confirm the analysis of June 2009 that stated that Britain had embarked upon a debt fuelled economic recovery into a May 2010 General Election.
Very little of this strong retail sales trend is visible in any of the official or academic economic data that continues to look in the rear view mirror of what is "old news". The actual trend shows that the Labour party has succeeded in igniting a debt fuelled election consumer boom that will increasingly become apparent in mainstream press as we approach the May 2010 election deadline, but it is also indicative a steep upward curve in UK inflation and we are talking about inflation hitting the upper end of the Bank of England's 1% to 3% CPI Band during the first half of 2010 which politically suggests the UK General Election may take place much earlier than the consensus view for a May 2010 General Election, perhaps as early as mid February i.e. before the release of January inflation data.
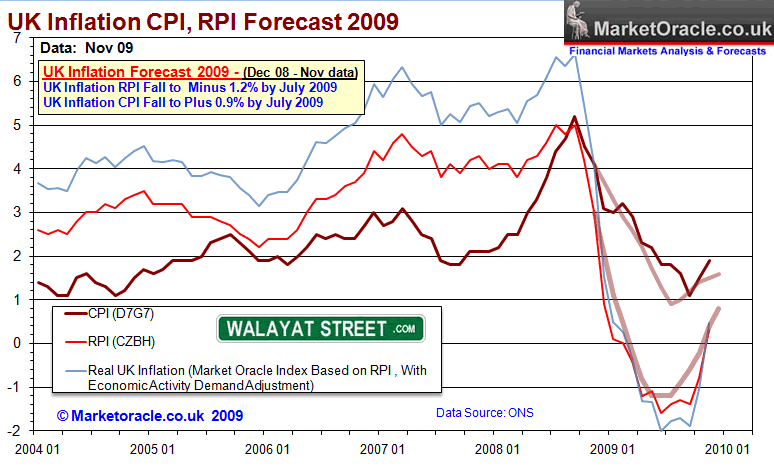
UK Inflation Forecast 2009
Deflationary forces as a consequence of the the bursting of the asset bubbles has fulfilled the deflation forecast for 2009 as per the original analysis of December 2008 - UK CPI Inflation, RPI Deflation Forecast 2009 that forecast Deflation into Mid 2009 targeting RPI of -1.2% and CPI of +0.9% to be followed by an uptrend into year end back into RPI inflation of +0.9% and CPI of +1.6% as illustrated by the below graph.

To ensure you get the in-depth analysis and precise forecasts for 2010 and beyond in your email in-box ensure you are subscribed to my always free newsletter.
Source: http://www.marketoracle.co.uk/Article16061.html
By Nadeem Walayat
http://www.marketoracle.co.uk
Copyright © 2005-09 Marketoracle.co.uk (Market Oracle Ltd). All rights reserved.
Nadeem Walayat has over 20 years experience of trading derivatives, portfolio management and analysing the financial markets, including one of few who both anticipated and Beat the 1987 Crash. Nadeem's forward looking analysis specialises on the housing market and interest rates. Nadeem is the Editor of The Market Oracle, a FREE Daily Financial Markets Analysis & Forecasting online publication. We present in-depth analysis from over 500 experienced analysts on a range of views of the probable direction of the financial markets. Thus enabling our readers to arrive at an informed opinion on future market direction. http://www.marketoracle.co.uk
Disclaimer: The above is a matter of opinion provided for general information purposes only and is not intended as investment advice. Information and analysis above are derived from sources and utilising methods believed to be reliable, but we cannot accept responsibility for any trading losses you may incur as a result of this analysis. Individuals should consult with their personal financial advisors before engaging in any trading activities.
Nadeem Walayat Archive |
© 2005-2022 http://www.MarketOracle.co.uk - The Market Oracle is a FREE Daily Financial Markets Analysis & Forecasting online publication.


