UK Inflation Analysis, M4 Money Supply Adjusted for the Velocity of Money
Economics / Inflation Dec 24, 2009 - 08:29 PM GMTBy: Nadeem_Walayat
 This is the next in a series of analysis as part of my unfolding inflationary mega-trend scenario towards the formulation of an inflation forecast for 2010 and beyond. I aim to complete the whole scenario including interest rates, economy and implications of before the end of December which will be published as an ebook that I will make available for FREE. Ensure you are subscribed to my always free newsletter to get the latest analysis in your email box and check my most recent analysis on the probable inflation mega-trend at http://www.walayatstreet.com
UK M4 Money Supply
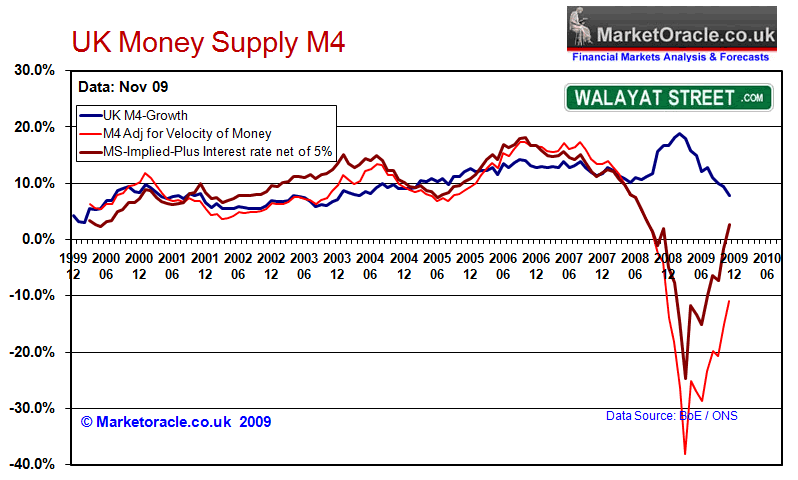
Whilst the mainstream press have been obsessed by headline M4 data throughout the past 12 months, however as I voiced in last years inflation analysis and forecast that the key to interpreting money supply data is to look at M4 adjusted for the velocity of money that implied imminent extreme deflation that has come to pass -
UK Money supply M4 (blue) has risen sharply from the 10% targeted low of mid 2008 to the current level of 16.6%, on face value this is highly inflationary and has been taken by many economists and market commentators to suggest much higher forward inflation. However the money supply adjusted for the velocity of money which takes into account the state of the economy as a consequence of the credit freeze tells a completely different story. The UK economy is now in extreme real monetary deflation of approaching -5%. The leading indicator of the implied money supply, is suggesting recent deep interest rate cuts of Novembers 1.5% and Decembers further 1% cut will lift future money supply growth out of extreme deflation, however it will still be far from supporting the levels north of 15% which accurately forecast forward inflation during 2008.

The M4 Graph shows opposing trends, it shows M4 falling from an extremely high level of near 20% that was jumped on earlier by the press to imply higher inflation, to now nudging below 10% to imply credit contraction deflation. However the real indicator of money supply shows the consequences of Quantitative Easing and near zero interest rates in that Money Supply adjusted for the velocity of money bottomed from a crash into March 2009, and it is only now that the money supply is breaking positive.
This suggests that the Bank of England and majority of economists remain mistakenly fixated on the headline M4 which has nudged below 10% and therefore continue with the policy of Zero Interest Rates and Quantitative Easing. What is remarkable in the most recent inflation data is the surge higher in both RPI and CPI (1.9%) despite weak money supply data, this strongly supports the view that the UK economy has drifted into a period of stagflation where models based on spare output capacity keeping inflation in check will fail ! I.e. we GET Inflation WITH spare capacity i.e. high unemployment, this is because the government is attempting to fill the output gap by increased public spending which is uncompetitive hence inflationary.
Therefore the expectations is for UK Money Supply adjusted for the velocity of money to continue surging higher and supportive of a strong trend higher in the RPI and CPI inflation indices that will leave the vast majority of the academic economists still mistakenly fixated on deflation scratching their heads.
I can easily see MS Implied surging higher to above 10% and M4 Adjusted passing above zero within the first quarter of 2010 on route to pre-credit crash levels during 2010, this also suggests a turnaround to some degree is also imminent in the M4 headline data.
UK Inflation Forecast 2009
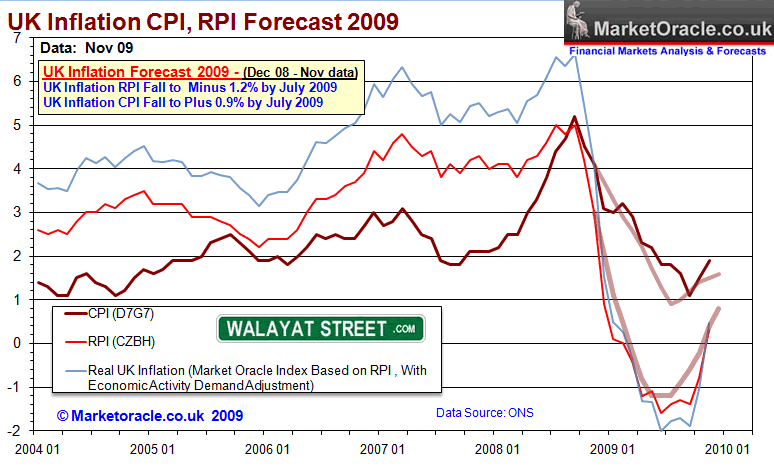
Deflationary forces as a consequence of the the bursting of the asset bubbles has fulfilled the deflation forecast for 2009 as per the original analysis of December 2008 - UK CPI Inflation, RPI Deflation Forecast 2009 that forecast Deflation into Mid 2009 targeting RPI of -1.2% and CPI of +0.9% to be followed by an uptrend into year end back into RPI inflation of +0.9% and CPI of +1.6% as illustrated by the below graph.

To ensure you get the in-depth analysis and precise forecasts for 2010 and beyond in your email in-box ensure you are subscribed to my always free newsletter.
Source:http://www.marketoracle.co.uk/Article16059.html
By Nadeem Walayat
http://www.marketoracle.co.uk
Copyright © 2005-09 Marketoracle.co.uk (Market Oracle Ltd). All rights reserved.
Nadeem Walayat has over 20 years experience of trading derivatives, portfolio management and analysing the financial markets, including one of few who both anticipated and Beat the 1987 Crash. Nadeem's forward looking analysis specialises on the housing market and interest rates. Nadeem is the Editor of The Market Oracle, a FREE Daily Financial Markets Analysis & Forecasting online publication. We present in-depth analysis from over 500 experienced analysts on a range of views of the probable direction of the financial markets. Thus enabling our readers to arrive at an informed opinion on future market direction. http://www.marketoracle.co.uk
Disclaimer: The above is a matter of opinion provided for general information purposes only and is not intended as investment advice. Information and analysis above are derived from sources and utilising methods believed to be reliable, but we cannot accept responsibility for any trading losses you may incur as a result of this analysis. Individuals should consult with their personal financial advisors before engaging in any trading activities.
Nadeem Walayat Archive |
© 2005-2022 http://www.MarketOracle.co.uk - The Market Oracle is a FREE Daily Financial Markets Analysis & Forecasting online publication.


