Market Update - Trading The Charts
Stock-Markets / Technical Analysis Jul 22, 2007 - 06:01 PM GMTBy: Dominick
 It's no secret that I've been getting closer and closer to calling a major top while maintaining the unbiased flexibility to trade both sides of the market as we approach our final destination. We've been perfectly cautious of overextended rallies, while also avoiding panic on the dips and buying bottoms. IF I could have my way from here, I would want to see this market attempt one more screaming rally to just above its recent highs and, at that point, if all things remained the same, I'd be willing to call for a substantial turn, not only in the stock indices, but in several other major markets.
As easy as that might sound, most market watchers in such a scenario would probably be talking about the breakout, and looking for a reversal would seem like going against the grain. Of course, a breakout would indeed be evident in the charts, but with many markets finally reaching my ultimate targets, I shouldn't have much of a problem calling a top from a new high, particularly as I expect clear confirmation of a turn to make the breakout a failure – or else there wouldn't be any call at all. If we can't construct a rally from Fridays close, or just a bit lower, then once price takes out some specific target levels, we'll start to get short and approach the market from a bearish perspective.
So, though it seems we are closer than ever now to a point where I would call a top, there's no confirmation at this point, despite Friday's selloff. In fact, though we didn't necessarily expect the declines because they were largely triggered by reaction to earnings, we did have the crucial levels to trade including the bottom of Friday's decline. In fact, the chart below was posted for members last Saturday, before the week's trading even began! Notice the bottom of the box is less than one point from the actual Friday SPX low of 1529.2.
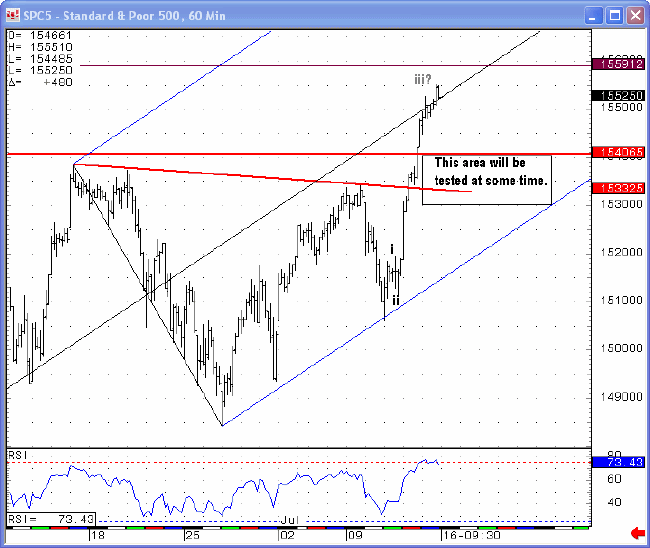
Over and over the markets prove the risk of trading based on a weekly update, and this week was no exception.
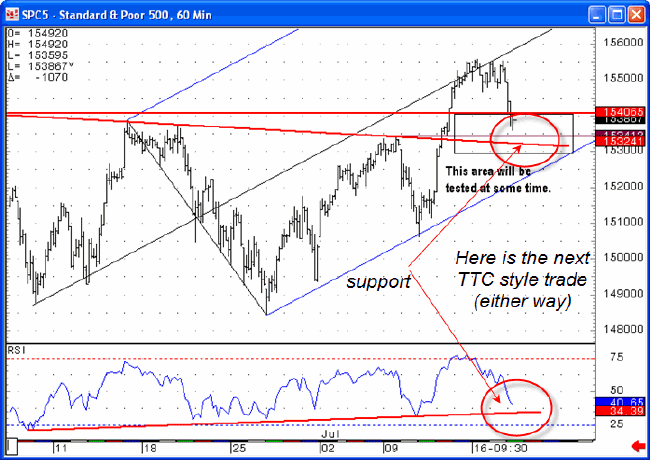
The chart from Saturday was updated and reposted Wednesday showing a typical trade setup as we see them. Having entered the area we expected would be retested, and with the RSI approaching an upward trendline, we didn't start talking about a market crash or a top – we anticipated and took a long into the close for what became Thursday's record-breaking rally. The chart below shows the result of our setup into that day's close with, as you know, the move completing the next day at a double top.
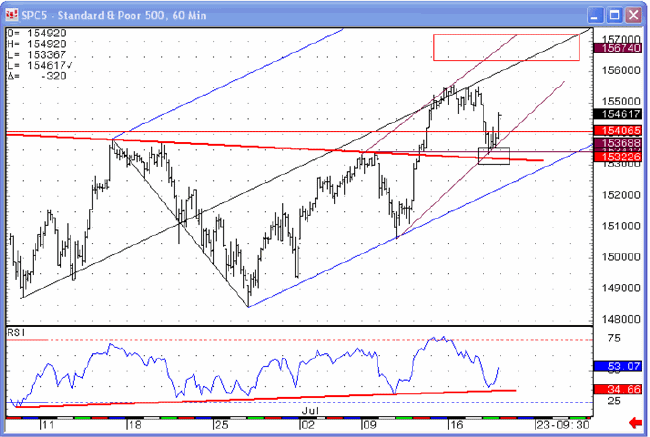
Of course, when Friday sold sharply, our test box proved to be spot on yet again, as already mentioned. But just as important as having the right numbers to work with, keeping the emotional aspect of trading under control can make or break a portfolio, especially on a roller coaster ride of week like this one. Because we understand that trading is very much a mental game, avoiding the temptation of overly bullish or bearish sentiment is the heart of unbiased trading and has been the source of much of our trading profits.
Speaking of psychology, I should also address the issue of taking responsibility for your own trades, particularly in relation to what traders euphemistically call “the PPT”, or Plunge-Protection Team. The simple fact is that the President's Working Group does exist and meet regularly, but their purpose is to protect the market against massive crashes. They have no business pushing the market to new highs, or getting involved when there's some minor selling pressure ten or twenty points below all-time record levels. As I showed above, when the market moved up Thursday, there were legitimate reasons to expect that move. Blaming bad trades on a shadowy conspiracy theory is exactly the sort of mentality we want to clear up and avoid.
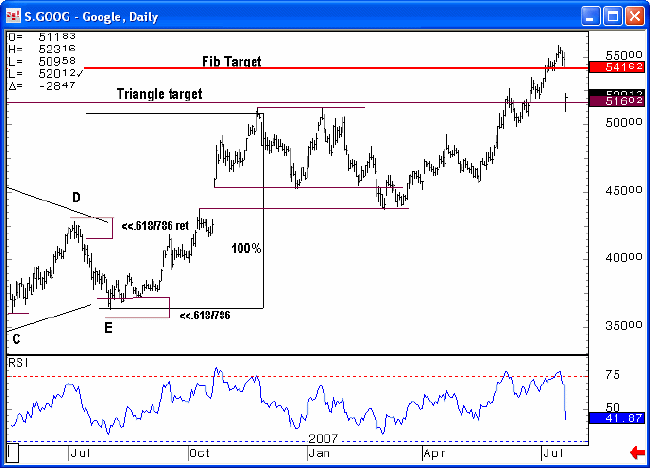
Back when Google was hit hard by a minor earnings miss (sound familiar?), pure Elliott wave suggested the upside in the stock was done. I stuck my neck out and posted the chart below with a target of 541.
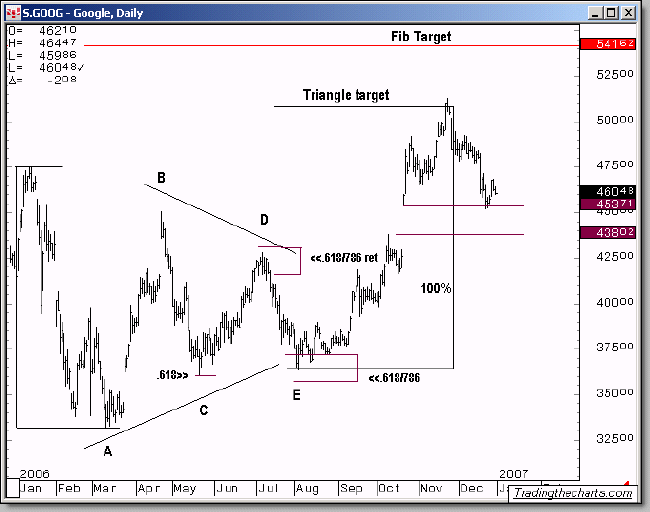
Sure enough, a year later Google makes it to the target and then sells off 40 points in globex Thursday night. Coincidence?
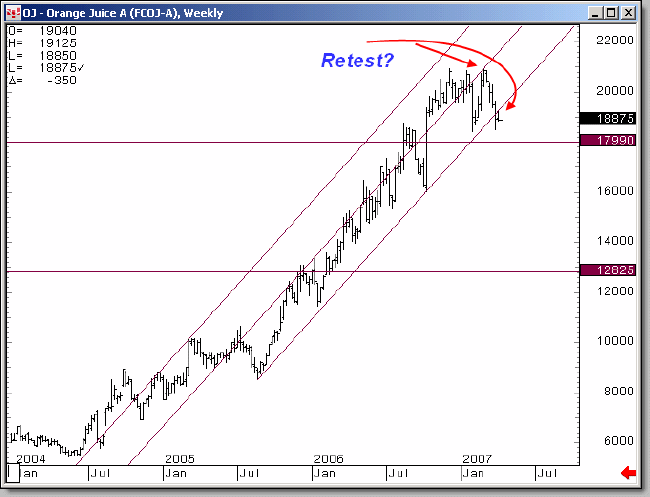
Or look at this chart in OJ. The down targets were placed months ago and are not Fibonacci retracement lines. This chart showed a perfect sell setup.
The next chart shows resistance to the first bounce at the first line and several weeks of vibration around the second line. This week OJ seems to have tested that line again and might be ready for an advance.
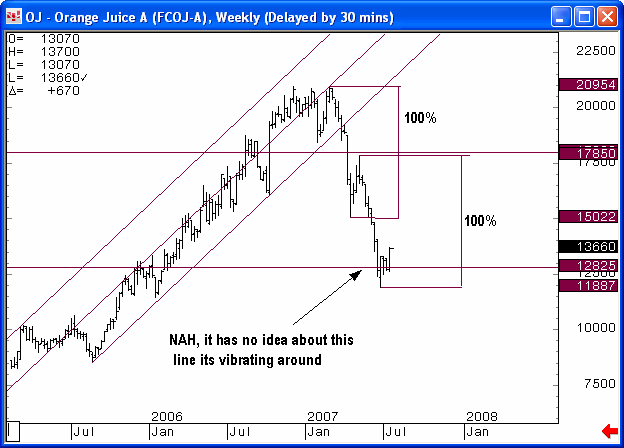
So now you can see what I meant that most major markets are currently at a critical point at or near my targets.
By Dominick
For real-time analysis, become a member for only $50
If you've enjoyed this article, signup for Market Updates , our monthly newsletter, and, for more immediate analysis and market reaction, view my work and the charts exchanged between our seasoned traders in TradingtheCharts forum . Continued success has inspired expansion of the “open access to non subscribers” forums, and our Market Advisory members and I have agreed to post our work in these forums periodically. Explore services from Wall Street's best, including Jim Curry, Tim Ords, Glen Neely, Richard Rhodes, Andre Gratian, Bob Carver, Eric Hadik, Chartsedge, Elliott today, Stock Barometer, Harry Boxer, Mike Paulenoff and others. Try them all, subscribe to the ones that suit your style, and accelerate your trading profits! These forums are on the top of the homepage at Trading the Charts. Market analysts are always welcome to contribute to the Forum or newsletter. Email me @ Dominick@tradingthecharts.com if you have any interest.
This update is provided as general information and is not an investment recommendation. TTC accepts no liability whatsoever for any losses resulting from action taken based on the contents of its charts, commentaries, or price data. Securities and commodities markets involve inherent risk and not all positions are suitable for each individual. Check with your licensed financial advisor or broker prior to taking any action.
Dominick Archive |
© 2005-2022 http://www.MarketOracle.co.uk - The Market Oracle is a FREE Daily Financial Markets Analysis & Forecasting online publication.


