


Stocks Bear Market Rally Last Thrust Higher?
Stock-Markets / Stock Index Trading Dec 20, 2009 - 05:08 PM GMTBy: Andre_Gratian

 Current Position of the Market
SPX: Long-term trend - Down! The very-long-term cycles have taken over and if they make their lows when expected, the bear market which started in October 2007 should continue until 2014. This would imply that lower prices lie ahead. As illustrated by the current market performance, this will not be a straight-down decline, but will consist of a series of intermediate-term rallies and declines until we have reached the low point.
SPX: Intermediate trend - The 1119.13 top achieved in early December remains the high of what is most likely a two-month distribution phase, but it may soon be challenged for the final time.
Analysis of the short-term trend is done on a daily basis with the help of hourly charts. It is an important adjunct to the analysis of daily and weekly charts which determines the course of longer market trends.
Daily market analysis of the short term trend is reserved for subscribers. If you would like to sign up for a FREE 4-week trial period of daily comments, please let me know at ajg@cybertrails.com .
Overview:
This is a picture of the weekly SPX MACD. Does it require any commentary? Actually, yes! Don't all rush for the exit just yet! As negative as this looks, we still do not have a sell signal, and Friday's action could mark the start of the final up-phase. On Friday, the index bounced off one of the trend lines which needs to be broken in order to signal a formal end to the rally -- that, and more -- which we will discuss later.
Friday was also the ideal date for the low of the 20-wk cycle. Should that turn out to have been the case, we should expect a rally of some sort, perhaps enough to put a finishing touch on the top and to reach my longstanding projection to 1135.
If, on the other hand, Monday turns out to be a down day closing below 1090, and follows through with a move below 1084, the SPX will have broken an important support level and it will be a good bet that the rally is over.
Monday is an important day!
What's ahead?
Chart Pattern and Momentum
Looking at the completele weekly chart does not improve the picture. The SPX is struggling to overcome a long-term trend line which, with other technical factors, has stopped the rally at least temporarily. But when you take into consideration the pattern of the lower indicator which is already in a downtrend, it looks like it's just a matter of time before the index will follow.
Even reaching the pink horizontal bar (1135 projection) would simply end up being a false break-out.
Let's take a look at the daily chart. Starting with the lower indicator which is based on A/D data, you can see that it has shown predominantly positive values except for a few brief dips into the negative. The momentum peak was in mid-September and was followed by a correction into early November. Since then, even though the index has returned to the positive, it has remained at a subdued level while the SPX went on to make a new high.
This breadth indicator is telling the same story as the MACD chart above and as the price index. The market is at the end of its run and is no longer attracting the degree of buying that it was earlier. When it turns negative again, it's a good bet that the SPX will start another decline which will continue as long as this index remains negative on balance.
This is unlikely to begin right away because the other indicator on this chart is at an oversold level, which is normally a signal that the price consolidation phase is probably over, or nearly over.
The index has been traveling within the confines of a channel marked with black parallel lines. On Friday, prices found support on the lower channel line and bounced into the close. That was not enough for a shortterm buy signal and will require some follow through next week if we are to have one more attempt at reaching new highs. The alternative would be to roll over and confirm an end to the rally by closing below 1084 on a daily basis.
Let's put the hourly chart under the microscope to see what the technical picture favors!
There are several possible interpretations of the consolidation structure, most of them bullish, so we won't dwell on this until we have more data. Subjectively, I have chosen to see a new short-term trend starting on 12/9 with waves 1 and 2 in place, and the beginning of a wave 3 on Friday.
Friday was also the ideal low point of the 20-wk cycle.
In order to confirm this, we should get a good opening on Monday. After touching and bouncing off the important bottom line of the trading channel on Friday, the SPX closed just shy of breaking out of its wave 2 channel, and of rising above the MAs which was required to give a buy signal for the beginning of wave 3.
Two of the three indicators have already crossed, and the third one is about to. Therefore, we are as close to a buy signal as we could possibly get, but some follow-through on the upside is needed for confirmation.
The overall picture is predominantly bullish, especially if the 20-wk cycle did, in fact, make its low on Friday, or even at the last low. That cycle gets no award for regularity and is often off by as much as two weeks.
Cycles
The most important cycle affecting the market at this time is probably the 4-year cycle which should be topping for a low in the Fall, next year. If this sounds familiar it's because I have kept this sentence from the last newsletter. Assuming that I am correct, we are probably witnessing a phase of distribution, not consolidation, but we won't know for certain until we have received a sell signal.
The 20-wk cycle is the most important cycle for the short term, because If it did make its low on Friday, it will provide the impetus for the final thrust to the projection level.
There are also some minor cycles bottoming in the next couple of weeks. They normally only create small price ripples in the main trend, and one of them could turn out to be wave 4.
Projections:
For some time, I have talked about a potential Fibonacci projection around 1135 to mark the end of the move from the March low. There are at least two measurements in the present structure which bring up that target.
From the last newsletter: On the Point & Figure chart, the SPX made a base from 10/30 to 11/03 which gives us a conservative potential count for the next top of 1120 to 1127. This is probably one of the reasons that we saw profittaking when the SPX touched 1119.13 on Friday (12/04).
Breadth
The NYSE Summation index (courtesy of StockCharts) is no longer oversold and is in fact approaching overbought on its RSI. A final rally in the SPX to its projection target would cause it to become overbought with severe negative divergence -- just what we need for a top.
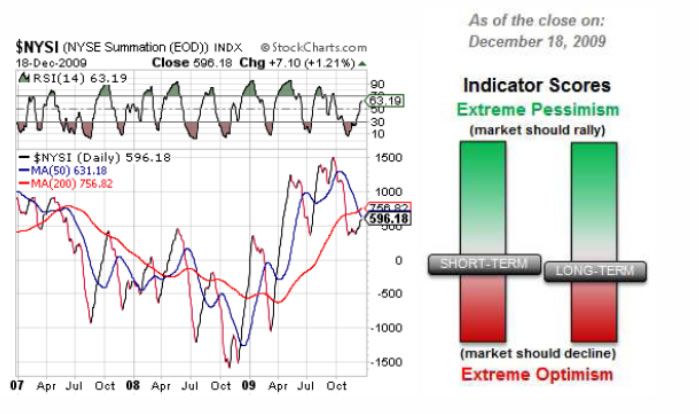
Market Leaders and Sentiment
The sentiment indicator (courtesy of SentimenTrader, above) is perfectly positioned to give us one final up wave. The short-term is neutral, and the longer-term indicator is slightly negative. Another rally would probably bring it down into the red, where we want it to be to signal an important top.
Other signs of a near-term top are too numerous to list here, but include relative weakness in the XBD and financial index. It does not include relative weakness in the NDX and it may be worth our while to keep this in mind.
Summary
We may be about to start the last small thrust to a new high and reach the 1130-1135 SPX target that will mark the end of the rally which started in March 2009 at 667.
The following are examples of unsolicited subscriber comments:
Awesome calls on the market lately. Thank you. D M
Your daily updates have taken my trading to the next level. D
… your service has been invaluable! It's like having a good technical analyst helping me in my trading. SH
I appreciate your spot on work more than you know! M
But don't take their word for it! Find out for yourself with a FREE 4-week trial. Send an email to ajg@cybertrails.com .
By Andre Gratian
MarketTurningPoints.com
A market advisory service should be evaluated on the basis of its forecasting accuracy and cost. At $25.00 per month, this service is probably the best all-around value. Two areas of analysis that are unmatched anywhere else -- cycles (from 2.5-wk to 18-years and longer) and accurate, coordinated Point & Figure and Fibonacci projections -- are combined with other methodologies to bring you weekly reports and frequent daily updates.
“By the Law of Periodical Repetition, everything which has happened once must happen again, and again, and again -- and not capriciously, but at regular periods, and each thing in its own period, not another’s, and each obeying its own law … The same Nature which delights in periodical repetition in the sky is the Nature which orders the affairs of the earth. Let us not underrate the value of that hint.” -- Mark Twain
You may also want to visit the Market Turning Points website to familiarize yourself with my philosophy and strategy.www.marketurningpoints.com
Disclaimer - The above comments about the financial markets are based purely on what I consider to be sound technical analysis principles uncompromised by fundamental considerations. They represent my own opinion and are not meant to be construed as trading or investment advice, but are offered as an analytical point of view which might be of interest to those who follow stock market cycles and technical analysis.
Andre Gratian Archive |
© 2005-2022 http://www.MarketOracle.co.uk - The Market Oracle is a FREE Daily Financial Markets Analysis & Forecasting online publication.