Revising U.S. Q4 Economic Growth Higher but 2010 Will Still Be Weak
Economics / Economic Recovery Dec 19, 2009 - 08:07 AM GMTBy: Paul_L_Kasriel
 Largely because of some recently-released economic reports, we have bumped up our real GDP forecast significantly for Q4:2009 and much less so for all of 2010. But we have not changed our fundamental view of the 2010 economic outlook. That view is that the recovery will continue through 2010, but will not be vigorous. Because we expect growth in the first half of 2010 to be slower than it was in the second half of 2009, we would not be surprised to hear the talking heads on CNBC start yapping about a "double dip." They are likely to be wrong, as usual.
The table below shows this month's forecast vs. last month's, with the major differences in bold-face type. With regard to the Q4:2009 forecast, the data in the table show that the increase in the forecast for real GDP growth of one percentage point from revised third quarter data is due primarily to stronger residential investment expenditures, a much smaller liquidation of inventories and a larger contribution from net exports. Although we have increased our forecast for growth in real personal consumption expenditures, the increase is relatively small at 0.2 of a percentage point.
Notice that the projected growth in real final sales has been increased by only 0.4 of a percentage point, indicative of the relatively large upward revision to the inventories component. Also note that although our forecast of Q4:2009 real GDP growth is 0.7 of percentage point higher than that of Q3:2009, our forecast of Q4:2009 growth in real final sales of domestic product is 0.3 of a percentage point lower than that of Q3:2009. Again, a slower liquidation pace of inventories in the fourth quarter is a major driver of top-line real GDP growth.
December 2009 forecast versus November 2009 forecast
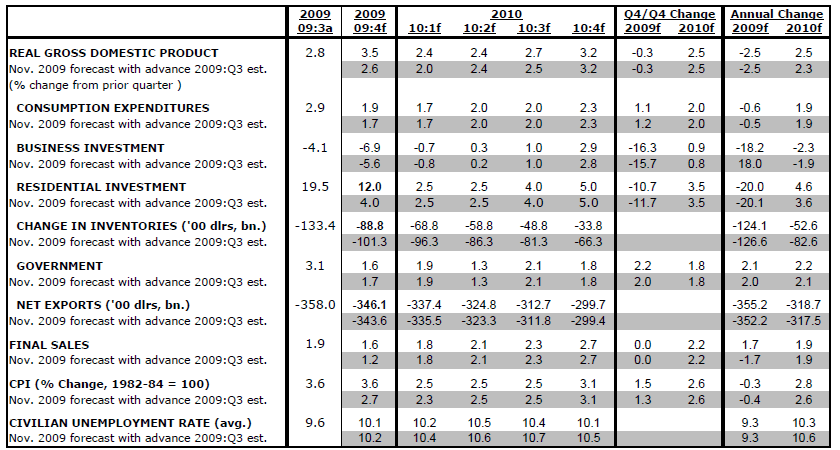
Shortly after the November retail sales report hit the tape, many forecasters might have been significantly boosting their estimates of Q4:2009 personal consumption expenditures. After all, nominal retail sales excluding motor vehicles, gasoline and building materials are running at an annualized pace of almost 4-1/2% in Q4:2009 vs. 1.4% in Q3:2009. Yes, but Q4:2009 unit motor vehicle sales are contracting at an annualized pace of about 25%. So, assuming that growth in real personal consumption expenditures excluding motor vehicles in the fourth quarter is about a percentage point higher than the October-November "run rate" of nominal retail sales ex motor vehicles, gasoline and building materials, assuming that growth in real personal consumption expenditures of services in the fourth quarter is about 70 basis points higher than that of the third quarter, which would be the fastest growth since the first quarter of 2008, but assuming the sharp contraction in motor vehicle real expenditures implied by the October-November average of unit sales compared to the third-quarter average, growth in total real personal consumption expenditures in the fourth quarter works out to a little less than 2% - slower than the third quarter's cash-for-clunkers super-charged 2.9% annualized growth. (Is this the longest sentence in recorded history?)
Although we have significantly reduced our projected rate of inventory liquidation for Q4:2009, we have not gone as far as some other forecasters. Yes, October total nominal business inventories did increase by 0.2%, the first monthly increase since August 2008. However, with manufacturers' and wholesalers' inventories of farm products and petroleum products excluded, business inventories were down 0.1% in October. The reason for excluding farm products and petroleum products from total inventories is the same one for excluding gasoline sales from total retail sales.
The nominal value of these inventories can be heavily affected by price changes. And, in fact, the prices of these products did increase significantly in October. So, real business inventories most likely did not increase nearly as much as did nominal inventories. Perhaps real inventories in October decreased yet again. We do, however, acknowledge that the rate of liquidation of real business inventories is slowing and that is a positive for real GDP. Thus, our forecasts of real GDP growth have been raised in both the Q4:2009 and Q1:2010 because of assumed less liquidation of inventories.
Another factor accounting for our upward revision to Q4:2009 real GDP growth is net exports. Real exports grew at an annualized pace of 17% in the third quarter and the October trade data suggest that real exports in the fourth quarter could grow even faster. This is largely due to the economic recoveries underway in the rest of the world. Almost 43% of the October increase in nominal U.S. exports of goods was purchased by Pacific Rim and South/Central American countries. We believe that developing economies will become even larger purchasers of U.S. exports in the coming years.
Housing completions are up and spending on home improvements went through the roof in October. This is what prompted us to raise our forecast for residential investment expenditures in the fourth quarter of this year.
All else the same, the large upward revision to our Q4:2009 real GDP forecast implies an upward revision to our average annual real GDP growth forecast for 2010 due to arithmetic. This, plus a little less assumed inventory liquidation in Q1:2010 has resulted in our forecast for annual average real GDP growth in 2010 increasing to 2.5% from last month's forecast of 2.2%. Despite the upward revision, this is tepid growth for a recovery, especially after such a deep recession.
Why do we not see more robust growth for 2010? Because the private financial system appears to remain incapable of creating much, if any, net new credit for the private sector.
Chart 1 shows the behavior of U.S. commercial bank credit to the private sector from January 1947 through November 2009. The contraction in credit provided to the private sector in the recent recessionary period is unprecedented in the post-war era. Although the rate of contraction slowed in November to 5.6% year over year, this still represents a decline not seen prior to the recent recession. To be sure, some of the decline in bank credit is due to weaker borrowing demand by the private sector.
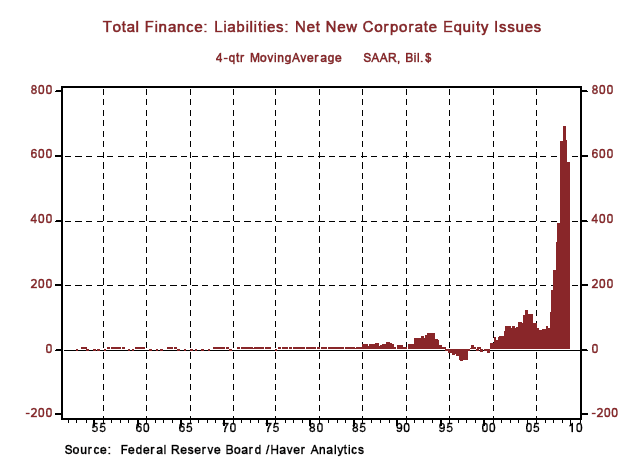
With inventories so low, businesses have cut back on their working capital needs. With capacity utilization so low, there is reduced demand for borrowing to fund capital expenditures. But we believe that the primary factor currently driving down bank credit and likely to restrict its growth in 2010 is bank capital. Although banks and other financial institutions have raised unprecedented amounts of equity capital in the past year (see Chart 2), they, of course, experienced an unprecedented "evaporation" of capital in the past two years. It is widely expected that another wave of capital evaporation is on the way in the form of commercial mortgage defaults.
Although the dollar amount of residential mortgages outstanding is over three times as large as the dollar amount of combined commercial and multi-family residential mortgages outstanding, the losses associated with commercial/multi-family mortgages are likely to be significant. Moreover, regulators, national and international, are considering phased-increases in required capital ratios for financial institutions. Therefore, a currently adequately capitalized financial institution may find itself inadequately capitalized a year from now due to new losses and/or higher required capital ratios.
Chart 1
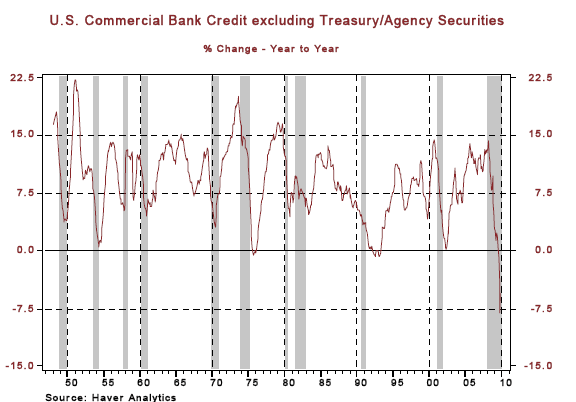
Chart 2
It is generally believed that the U.S. economy needs to grow in the range of 2-3/4% to 3% annually to maintain the level of the unemployment rate. Given our forecast of 2.5% real GDP growth for 2010, we expect the annual average unemployment rate level to be higher in 2010 than it was in 2009. Although the reported decline in the unemployment rate from 10.2% in October to 10.0% in November was encouraging, we believe it was just statistical "noise." Rather, we see the unemployment edging higher in the first half of 2010, peaking at about 10-1/2%, and then slowly falling in the second half of the year, ending up in the fourth quarter of 2010 about where it was in the fourth quarter of 2009.
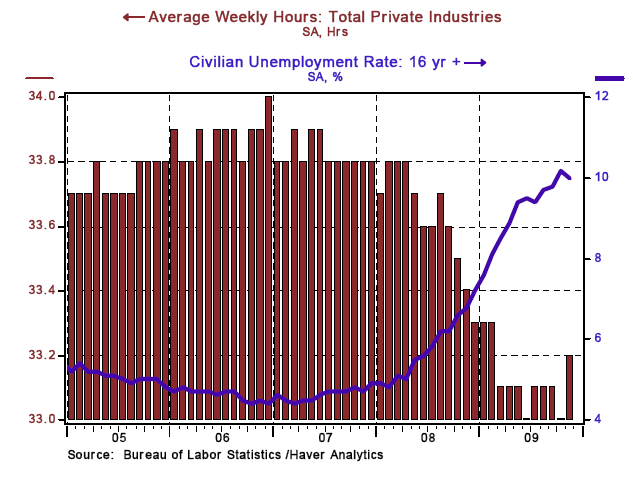
In addition to relatively slow growth, another impediment to a speedy decline in the unemployment rate is a low average work week. As shown in Chart 3, when the unemployment rate hit a cycle low of 4.4% back in March 2007, the average work week was 33.9 hours. In this past November, the average work week was only 33.2 hours. Thus, businesses can increase their output to meet rising demand by extending the working hours of their existing staff rather than having to hire additional staff.
Chart 3
Yet another impediment to rapid job growth and a declining unemployment rate is the structural change the U.S. economy is undergoing. Although it is encouraging that motor vehicles sold at an annualized pace of almost 11 million units in November, this still is a far cry from the almost 17 million units sold in 2005. We are told that U.S. producers are anticipating that motor vehicle sales will settle in at about 14 million units annually. Regrettably, this implies that some currently unemployed auto-sector workers will never find employment in this industry again. They will have to acquire training to qualify for jobs in different industries, which takes time. The same holds true for some currently unemployed real estate brokers, mortgage brokers, bricklayers and financial engineers.
Although commodity prices have risen significantly this past year, largely because of increased demand in the face of the global economic recovery, and these prices could continue to trend higher in 2010, we do not believe that this will push consumer inflation to a particularly "threatening" level. Again, final demand will not be sufficiently strong to enable businesses to pass on higher commodity prices to their customers.
Although we do not put as much emphasis on labor costs be a cause of inflation as others do, to the degree that they might be, they will not be in 2010. If the unemployment rate behaves as we expect, labor will not be in a strong bargaining position to secure large wage and salary increases. Moreover, labor productivity growth will remain relatively high, keeping unit labor cost growth in check.
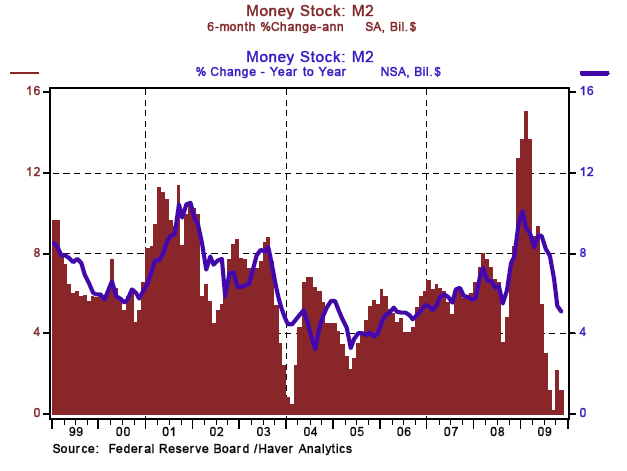
Professor Milton Friedman, may he and his lovely wife, Rose, rest in peace, taught us that inflation is always and everywhere a monetary phenomenon. He was referring to rapid growth in the broad money supply, not the monetary base, as the principal cause of high inflation. Chart 4 would suggest that if Friedman were alive today, he would not be sounding an inflation alarm. In the six months ended November, the M2 money supply grew at an exceptionally low rate of 1.2%. Year over year in November, M2 grew at 5.1%, not alarmingly high in an historical context. Moreover, the year-over-year growth in M2 is trending lower, not higher.
Chart 4
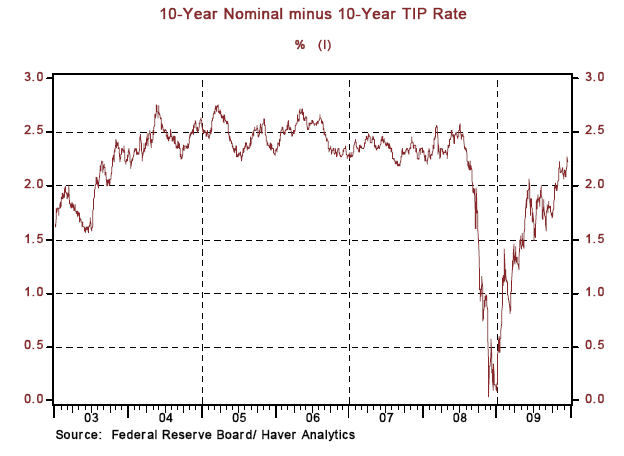
Despite this year's depreciation of the dollar in increase in the price of gold, a market-based proxy for investor inflation expectations has not signaled much concern (see Chart 5). Yes, the market-based expectation of average CPI inflation over the next ten years has risen from near zero late last year to about 2-1/4% currently. But late last year, the global economy was on the precipice of another Great Depression, which, if we had fallen over, would have ushered in deflation. But we did not fall over the precipice and we now are experiencing an economic recovery. So, deflation is off the table. But inflation expectations remain below where they were pre-Lehman. In addition to this market-based measure, we have two other gauges of inflation expectations. When a national men's clothing store chain stops offering three suits for the price of none and when a national upscale steakhouse chain abandons its "value meal" menu, then we will know that inflation is about to move much higher!
Chart 5
In addition to revising our 2010 real GDP forecast marginally, we also have revised our Fed policy forecast marginally. Last month, we expected the Fed to begin tightening policy at its late-June 2010 FOMC meeting. We now have pushed the tightening back to the early-August 2010 FOMC meeting. In preparation for an explicit tightening, we expect the Fed to allow the federal funds rate to drift up to 0.25%, the top of its current target range, in the second quarter of 2010. At the Fed's midyear report to Congress, we think that the Fed chairperson, presumably Ben Bernanke, will prepare the world for the imminent commencement of a tightening cycle. Although we are forecasting an acceleration in economic growth in the second half of 2010, this growth still is relatively restrained. Therefore, the Fed tightening we foresee in the second half of 2010 also is restrained, with the funds rate ending the year at a level of 1-1/4%. It will be in 2011 when Fed tightening gets more aggressive.
We wish our readers a happy holiday season. And don't forget to see "Feed the Fish".
Paul Kasriel is the recipient of the 2006 Lawrence R. Klein Award for Blue Chip Forecasting Accuracy
By Paul L. Kasriel
The Northern Trust Company
Economic Research Department - Daily Global Commentary
Copyright © 2009 Paul Kasriel
Paul joined the economic research unit of The Northern Trust Company in 1986 as Vice President and Economist, being named Senior Vice President and Director of Economic Research in 2000. His economic and interest rate forecasts are used both internally and by clients. The accuracy of the Economic Research Department's forecasts has consistently been highly-ranked in the Blue Chip survey of about 50 forecasters over the years. To that point, Paul received the prestigious 2006 Lawrence R. Klein Award for having the most accurate economic forecast among the Blue Chip survey participants for the years 2002 through 2005.
The opinions expressed herein are those of the author and do not necessarily represent the views of The Northern Trust Company. The Northern Trust Company does not warrant the accuracy or completeness of information contained herein, such information is subject to change and is not intended to influence your investment decisions.
Paul L. Kasriel Archive |
© 2005-2022 http://www.MarketOracle.co.uk - The Market Oracle is a FREE Daily Financial Markets Analysis & Forecasting online publication.
Comments
|
Yafit
12 Jan 10, 05:04 |
Source of the First comparison table.
Hi, I enjoyed reading this article. What is the source of the first tabl (December 2009 forecast versus November 2009 forecast )? Thanks. |


