The Inflation Mega-trend and the Illusion of Price Deflation
News_Letter / Inflation Dec 17, 2009 - 01:34 PM GMTBy: NewsLetter
 The Market Oracle Newsletter
December 16th, 2009 Issue #93 Vol. 3
The Inflation Mega-trend and the Illusion of Price DeflationDear Reader This analysis seeks to get to the heart of the matter to answer the question - Have we experienced Deflation and IF we have are we still in Deflation Now ? This is the next in a series of articles as part of my unfolding inflationary mega-trend scenario that is an important stepping stone towards the formulation of a inflation forecast for 2010 and beyond. I am to complete the whole scenario and implications of before the end of December which will be published as an ebook that I will make available for FREE. Ensure you are subscribed to my always free newsletter to get the latest analysis in your email box and check my most recent analysis on the probable inflation mega-trend at http://www.walayatstreet.com What is Deflation ? http://en.wikipedia.org/wiki/Deflation In economics, deflation is a decrease in the general price level of goods and services.[1] Deflation occurs when the annual inflation rate falls below zero percent (a negative inflation rate), resulting in an increase in the real value of money – allowing one to buy more goods with the same amount of money. This should not be confused with disinflation, a slow-down in the inflation rate (i.e. when inflation decreases, but still remains positive).[2] As inflation reduces the real value of money over time, conversely, deflation increases the real value of money – the functional currency (and monetary unit of account) in a national or regional economy. http://www.investopedia.com/terms/d/deflation.asp A general decline in prices, often caused by a reduction in the supply of money or credit. Deflation can be caused also by a decrease in government, personal or investment spending. The opposite of inflation, deflation has the side effect of increased unemployment since there is a lower level of demand in the economy, which can lead to an economic depression. Central banks attempt to stop severe deflation, along with severe inflation, in an attempt to keep the excessive drop in prices to a minimum. Deflation is the decrease of general prices in an economy. The most widely recognised measure of which is the Consumer Price Index (CPI), the composition of which aims to standardise the measure of prices of economies across the world to enable easier comparative analysis. Unfortunately many analysts mistakenly pick and choose alternative measures against which to support their own point of views at a particular point of time. This pick and mix attitude to analysis is not just limited to deflationists, but inflationists also have been seen to seek propaganda over facts. Inflation or Deflation is not measured by comparing one asset value against another i.e. Comparing Gold Prices against House Prices. Whilst they may form PART of a deflationary or inflationary scenario, they ARE NOT AT THE CORE of Inflation or Deflation, so such arguments as if they represent Inflation or Deflation are NOT analysis but rather PROPOGANDA. Now, whilst my Inflation mega-trend analysis is primarily focused on the UK economy for obvious reasons as that is where i reside, however the same could apply to the United States and most other Western developed economies. UK Consumer Price Index (CPI)
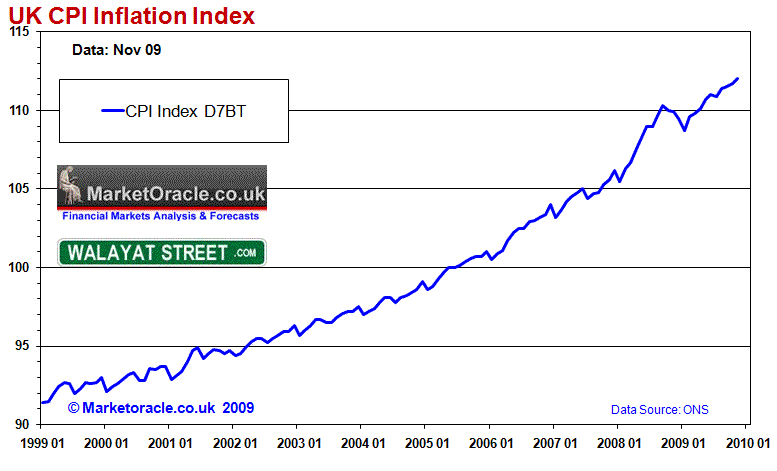
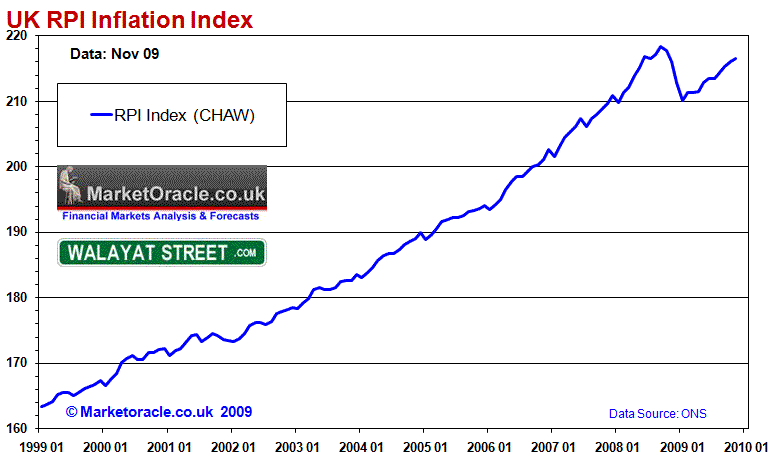
The UK Consumer Price Index (CPI) clearly illustrates that all we saw from mid 2008 and into early 2009 was a minor deflationary corrective wave amidst an ocean of year on year inflation. Subsequent inflation has far surpassed the in-consequential deflation seen during 2008 and into early 2009. Therefore the facts are completely contrary to the headline grabbing mainstream press and blogosphere scare mongering of price deflation. There has been NO SIGNIFINCANT DEFLATION, despite economic contraction of more than 5% GDP, despite Unemployment soaring to above 2.5 million, despite asset price destruction ranging from between 25% and 50% into the early 2009 lows. In fact the deflation that we witnessed is probably mostly due to the sharp drop in commodity prices such as Crude Oil's collapse from mid 2008 into early 2009. What does this suggest? It suggests that severe economic contraction, debt deleveraging and asset price destruction only succeeded in generating a minor corrective wave against the inflationary mega-trend, which therefore looks set to return with a vengeance over the coming years which my Inflation Mega-trend scenario analysis continues to conclude towards as the Government and the Bank of England as with other central banks is mistakenly continuing to be fixated with fighting deflation. UK Retail Prices Index (RPI) Whilst the CPI is the governments preferred measure of UK inflation i.e. because it is less volatile then its predecessor the RPI index, which is the more recognised measure of UK inflation by the people of Britain as it pre-dates the CPI by many decades.
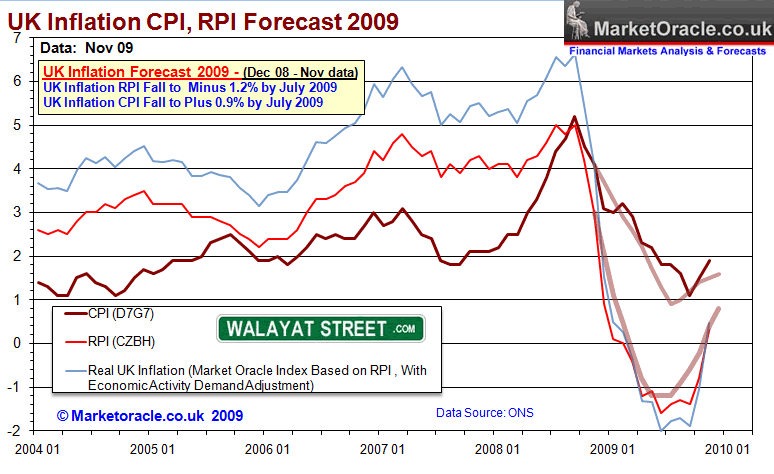
The above graph shows that the RPI has experienced stronger deflation than that seen in CPI. However this is due to government intervention, specifically in forcing UK interest rates down to an artificially low rate of 0.5%, coupled with funneling near unlimited tax payer cash to the bailed out banks by means of quantitative easing, capital injections and bad debt loan insurance has created an artificial banking system that generates huge unprecedented profit margins for the banking industry for the purpose of the banks to rebuild their balance sheets, though as we have seen with bank bonuses this is not what the bankster's are actually doing instead choosing to pay out artificial profits as bonuses, which is tantamount to more fraud on the tax payer. Basically the artificial banking system has forced mortgage costs artificially lower to enable the bankrupt bailed out zombie banks to survive, and it is this which is reflected in the RPI Index, accounting for much of the extended downtrend into early 2009 coinciding with the low in UK interest rates of 0.5% and the start of the bounce in UK house prices. The subsequent trend looks set to complete the process of retracing the whole of the deflationary downdraft during the coming months as the RPI also confirms that the deflation of 2008-2009 was just a corrective wave amidst an ocean of inflation. My UK inflation forecast for 2010 and beyond will be completed during the coming week which will aim to project the likely trend for both UK CPI and RPI, ensure you are subscribed to my always free newsletter to get this in your email box. UK Inflation Forecast 2009 The Inflation mega-trend scenario is now starting to manifest itself in UK Inflation data for November which shows the Governments preferred measure CPI inflation surging higher to 1.9% up from 1.5% and RPI reversing October Deflation of -0.8% to now stand at Inflation of +0.3%. Deflationary forces as a consequence of the the bursting of the asset bubbles has fulfilled the deflation forecast for 2009 as per the original analysis of December 2008 - UK CPI Inflation, RPI Deflation Forecast 2009 that forecast RPI Deflation into Mid 2009 targeting -1.2% and CPI Inflation of +0.9% to be followed by an uptrend into year end back into RPI inflation of +0.9% and CPI of +1.6% as illustrated by the below graph.
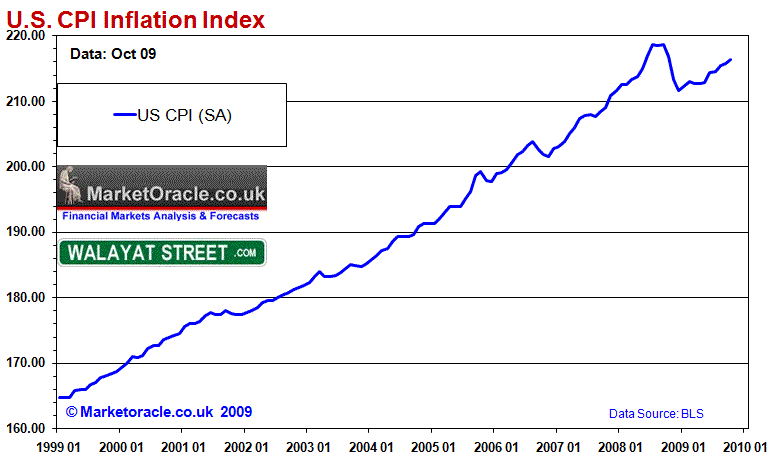
U.S. Consumer Price Index (CPI) Just to make sure that the UK economy is not experiencing a case of freakanomics, here is the CPI inflation graph for the United States of the past 10 years.
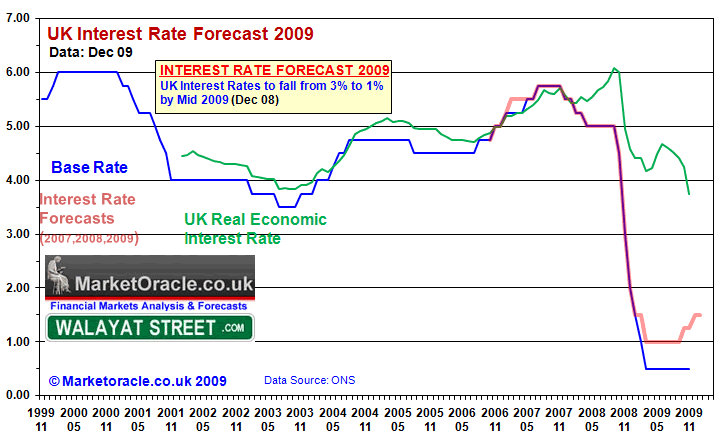
Leaving aside the conspiracy theorists that say that real U.S. Inflation is at 7% rather than that of official data, U.S. CPI Inflation has followed a similar trend to UK RPI Inflation in that real deflation from mid 2008 into early 2009 has subsequently reverted back to the long-term inflationary trend. The U.S. CPI deflationary corrective wave was due to the exact same influences as that witnessed in UK RPI i.e. housing bear market and the commodity price crash (primarily crude oil). However the graph does not support the deflationist argument that has in some cases been in existence for more than 10 years with a cluster following the dot com bubble bursting, following which time inflation has continued to erode the value of money at trend. I need to remind readers again that the inflationary uptrend from early 2009 has been during a period of severe economic contraction and weak recovery, if we were in a deflationary environment then U.S. CPI should be either declining or flat-lining. Which suggests that if the U.S. Economy stagnates then the INFLATION trend will continue upwards, however should the U.S. economy surprise to the upside then the Inflation trend will accelerate even higher, either way there is NO DEFLATION at the present nor in the coming years which just leaves me shaking my head at Deflationists that continue conjuring deflationary outlooks that have little if any basis in the actual data. Japan Deflation? The only major economy that is said to have experienced general price deflation is Japan, but even there when we take a close look at this so called Japanese price deflation all I see is overall FLAT general prices i.e. neither inflation nor deflation. Therefore a worst case scenario for the Inflationary mega-trend would be along the lines of Japanese style outcome of flat prices over the next decade rather than REAL deflation. The Illusion of Deflation The corrective deflationary wave has suckered many, many analysts and perma academic economists into the deflation argument, perhaps rather than harking back to 1930's deflation the deflationists need to take a step back and look at big picture of the inflationary mega-trend. This is NOT the 1930's, unlike the 1930's the bankrupt banks are not being allowed to go bankrupt. Instead governments are hell bent on inflating their way out of the crisis which means even higher inflation, more so than trend inflation. The flaw in the deflationists argument is staring them right in the face, in that during the 1930's the academic economists looked to the series of economic crisis following the Great War, and therefore their proposed actions resulted in the deflation of the 1930's. Whereas today's academic economists look to the 1930's as though it is a caste in stone road map of what is to follow, whereas it is the same academic economists that are feeding input into Governments of Deflation that surely will result in the contrary outcome, just as the deflation of the 1930's was contrary to the high inflation of the early 1920's. In Britain at the time of writing the National Audit Office has declared that the British tax payer has assumed a liability of £850 billion as a consequence of bailing out the bankrupt banks. When a country effectively doubles its national debt within a year is that the sign of Deflation or nearer Zimbabwe style inflation? No i am not saying Britain is heading for hyper inflation but the trend is strongly in favour of inflation much more so than the illusory Deflation trend that is taken as fact when it only really exists in the ivory tower of academics. The Markets Discount the Future Whilst debt deleveraging continues in the present, however market participants should be reminded of the fact that the market discounts the future and not past or present!, Therefore the whole debt deleveraging scenario should be IGNORED, much as I voiced in March 2009 that the whole scenario of contracting corporate earnings should be IGNORED, in that is not what the market will discount next, In March my view was that stocks will discount a flood of liquidity and economic recovery ( 15th Mar 2009 - Stealth Bull Market Follows Stocks Bear Market Bottom at Dow 6,470) and has subsequently soared by as much as 60% during 2009. Now my analysis continues to converge towards the inflation mega-trend which the market will again start to discount well in advance of. UK Interest Rates & Economy The UK base interest rate is being kept artificially low so as to enable the bankrupt banks to rebuild their balance sheets by overcharging customers against the base interest rate and the interbank market rate of 0.59% as the real market interest rates have been in a steady climb since March 2009 which has increasingly meant that the base interest rate has become irrelevant to the retail market place as explained in the article - Bailed Out Banks Not Lending, Sitting on Tax Payers Cash. The outlook remains for rising market interest rates charged to retail customers regardless of the base rate having been held at 0.5% into the end of the year, which is inflationary in terms of rising mortgage costs.
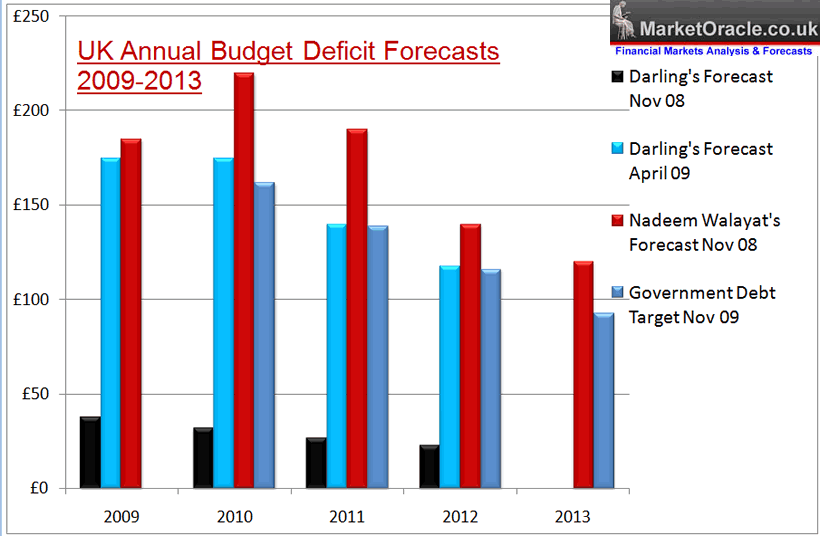
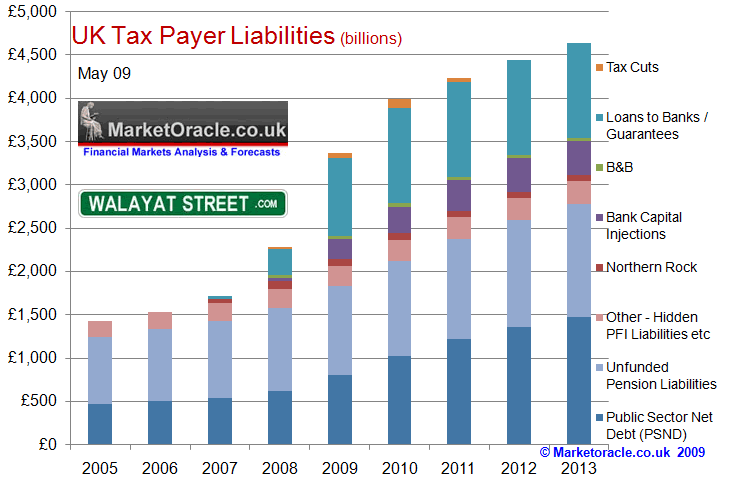
Savers Forced to Pay for Bankster Crimes Savers are being hit by the double whammy of 1.9% Inflation plus the 20% tax on savings and therefore require a minimum interest rate in the order of 2.30% just for savings to keep pace with inflation and taxes. This is set against the tax payer bailed out banks such as the Halifax paying a pittance of just 0.1% on across the range accounts from current accounts to savings accounts with other mainstream institutions not far better, which is a consequence of bailout out the bankrupt banks that has resulted in an artificial market heavily skewed in favour of the bailed out bankrupt banks making huge profits so that tax payer capital injections can be repaid, in-effect the government giving free cash to the banks to enable the banks to repay capital for political reasons. In effect the Banks and the Labour Government are systematically stealing the value of Savings. The situation is even worse for Cash ISA holders as the tax payer bailed out bankster's hit new depths of paying ISA holders typically 20% LESS than comparable accounts, therefore are defrauding Cash ISA holders of their tax free allowances. Under a free market system the banks would be forced to raise interest rates paid to customers to entice savers, however in today's market the Treasury and the Bank of England fund the banks to the tune of liabilities of £1.5 trillion that has resulted in the countries liabilities doubling from £1.7 trillion at the end of 2007 to £3.4 trillion by the end of this year on route towards liabilities of £4.75 trillion. Debt Fuelled Economic Recovery Heading for Double Dip Recession The UK economy remains on track to bounce back into the 2010 election, as indicated by June's in depth analysis, however this economic recovery is based purely on debt as shown by the graph below, as the Labour government's strategy is to deliver the next Conservative government a scorched earth economy.
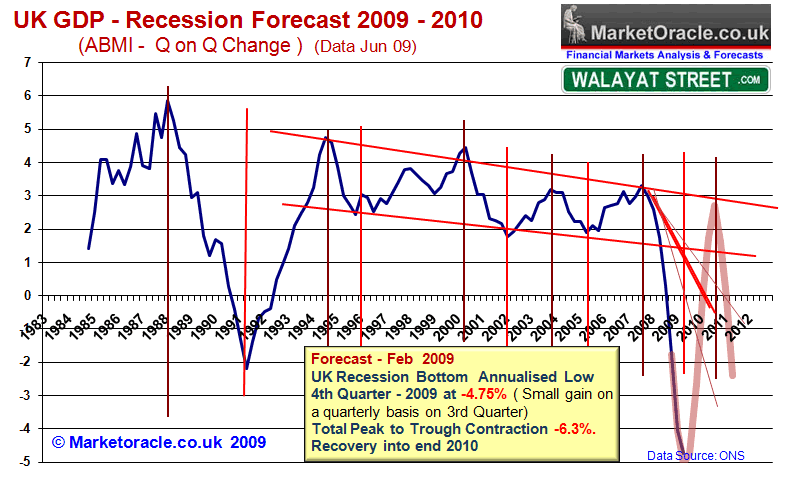
Alistair Darling's forecast for government net borrowing for 2009 and 2010 in November 2008 totaled just £70 billion. However, since the amount of projected borrowing has mushroomed to £350 billion, which is set against my November forecast of £405 billion for 2009 and 2010 alone, with continuing subsequent large budget deficits thereafter of well above £100 billion a year. Whilst many economists were surprised by Alistair Darling's April forecast that the UK Economy would grow by 1.25% in 2010 and 3.5% in 2011. However we need to consider the following in that 1.25% growth on the annual GDP of £1.2 trillion equates to growth of just £15 billion and for 2011; 3.5% growth equates to just £42 billion. Therefore the government is borrowing a net £175 billion for 2009 and £175 billion for 2010 to generate £15 billion of growth, and then a further £140 billion for 2011 for £42 billion of growth. Thus total net borrowing of £490 billion to grow the economy by just £67 billion, (£595 billion my forecast) which shows the magnitude of the scorched earth economic policy now implemented that literally aims to hand the next Conservative government a bankrupted economy that will be lumbered with the consequences of continuing huge budget deficits and therefore necessary deep cuts in public spending. Whilst the OECD and other mainstream organisations / press have been busy in recent months revising their economic forecasts, my forecast remains as is and continues to project towards post general election tax hikes and deep public spending cuts that will in my opinion trigger a double dip RECESSION during 2011 to 2012 as illustrated by the graph below.
Bankrupting Britain Debt and Liabilities The total liabilities as a consequence of bailing out the bankrupt banks and debt fuelled economic recovery remains on target of £4.75 trillion by the end of 2013/14, which confirms that Britain remains firmly on the path of a probable decade of economic stagnation coupled with high inflation i.e. stagflation.
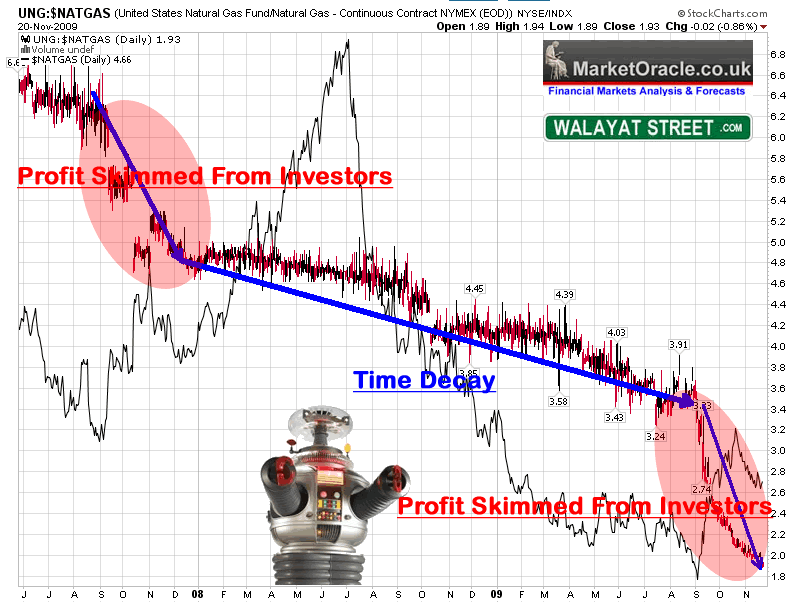
For more on my inflationary mega-trend ensure your subscribed to my always free newsletter, especially as I converge towards including major forecasts for all key markets for 2010. I.e. what will become of the stocks stealth bull market that has soared during 2009 ? What about the debt fuelled UK housing market and economic bounce. Are GLD and SLV ETF's Good Proxies for Gold and Silver Bullion Investing? My recent analysis on Natural Gas and UNG ETF (22 Nov 2009 - Natural Gas Screaming Long-term Inflation Mega-trend Buy, But UNG...) concluded:
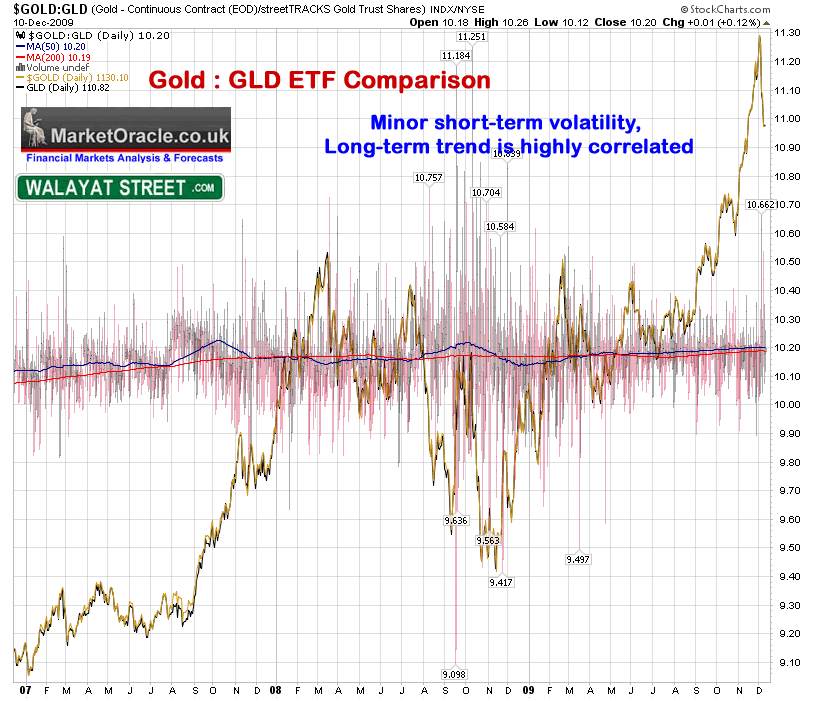
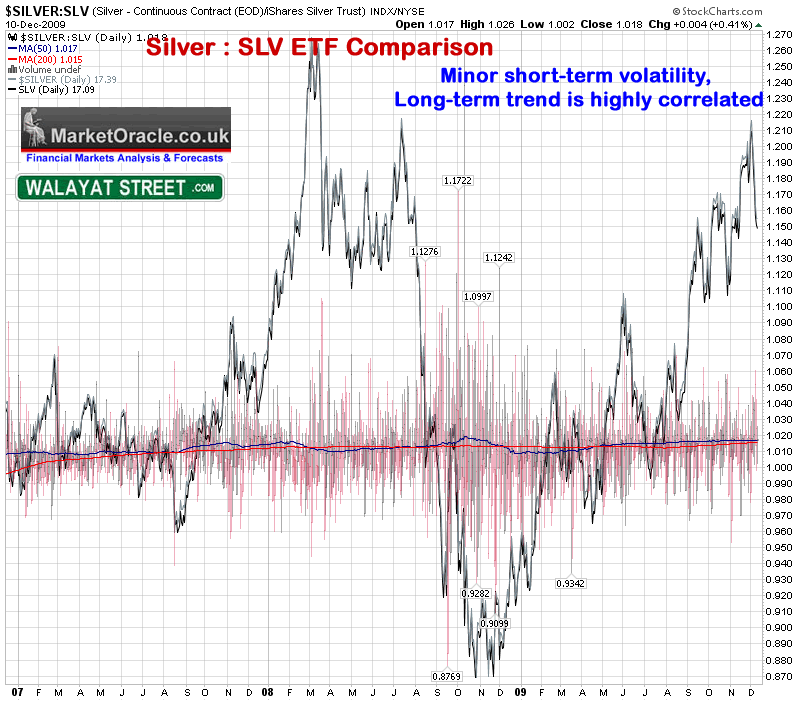
The second chart illustrates that there exists a perpetual tendency for the ETF to under perform the futures over time, which deploys a similar trick to the Leveraged ETF's in utilising % of daily movements. What this means is that UNG IS NOT A GOOD LONG-TERM INVESTMENT ! If you invest in UNG, you have to get your timing right, else TIME will erode the value of your investment even if Natural Gas DOUBLES in price! However on top of this we have PROFITS which are SKIMMED from investors as indicated by UNG that FAILS to rise when the Natural Gas price goes up! This analysis continues the study of the price trend relationship between Gold : GLD and Silver : SLV as part of the inflationary mega-trend investing as the following graphs illustrate:
Both graphs show that during the past 3 years and at the present time, the spot prices of Gold and Silver are highly correlated in terms of trend with their GLD and SLV ETF equivalents for a similar period of time. ETF Expenses Investors should note that both GLD and SLV ETF's deduct annual expense ratio's of 0.4% for GLD and 0.5% for SLV which over time will erode the value of the funds and result in a significant discount to the spot price for investments spanning several decades, though it should also be noted that the expense ratios compare favourably to the fees charged for bullion storage that can amount to more than 1% per annum. For instance Gold is up approx 20% over the past 12 months, against the expense ratio of 0.4%, therefore is not of any real significance for medium term investments (upto 5 years). ETF Risks I understand that a number of rumours are doing the rounds during the past few weeks of potentially 1.4 million fake tungsten gold bars in existence, of which many form part of the GLD ETF holding. However the GOLD:GLD price trend relationship suggests that there is no substance to these rumour's for if these rumours were true then GLD would be trading at a significant discount to the spot Gold price. Though that it is not to say that some future event may bring about such a large discount. Leaving aside the risk of fake gold, there is also the risk of that during a currency crisis the U.S. Government seizing the Gold held in New York, maybe if it were disbursed across several vaults in several countries this would ensure greater security. Other risks exist as with all ETF's i.e. that of the risk of theft and fraud. Though as I have pointed out earlier, if in the future a problem with the GLD and SLV did start to occur, we would see it manifest itself in the spread between GLD and Gold, as the smart money would start to exit the fund first. Recent articles on the unfolding inflationary MEGA-TREND outlook include :
Source: http://www.marketoracle.co.uk/Article15836.html By Nadeem Walayat Copyright © 2005-09 Marketoracle.co.uk (Market Oracle Ltd). All rights reserved. Nadeem Walayat has over 20 years experience of trading derivatives, portfolio management and analysing the financial markets, including one of few who both anticipated and Beat the 1987 Crash. Nadeem's forward looking analysis specialises on the housing market and interest rates. Nadeem is the Editor of The Market Oracle, a FREE Daily Financial Markets Analysis & Forecasting online publication. We present in-depth analysis from over 400 experienced analysts on a range of views of the probable direction of the financial markets. Thus enabling our readers to arrive at an informed opinion on future market direction. http://www.marketoracle.co.uk Disclaimer: The above is a matter of opinion provided for general information purposes only and is not intended as investment advice. Information and analysis above are derived from sources and utilising methods believed to be reliable, but we cannot accept responsibility for any trading losses you may incur as a result of this analysis. Individuals should consult with their personal financial advisors before engaging in any trading activities.
You're receiving this Email because you've registered with our website. How to Subscribe Click here to register and get our FREE Newsletter To access the Newsletter archive this link Forward a Message to Someone [FORWARD] To update your preferences [PREFERENCES] How to Unsubscribe - [UNSUBSCRIBE]
The Market Oracle is a FREE Financial Markets Forecasting & Analysis Newsletter and online publication. |
||||||||||||||
© 2005-2022 http://www.MarketOracle.co.uk - The Market Oracle is a FREE Daily Financial Markets Analysis & Forecasting online publication.


