


Stock Market Headwinds Abate Slightly
Stock-Markets / Stock Index Trading Dec 14, 2009 - 10:12 AM GMTBy: Guy_Lerner

 Last week the price of crude oil lost almost 10% pushing our composite indicator that is constructed from the trends in gold, crude oil and yields on the 10 year Treasury back below the extreme line. See figure 1 a weekly chart of the S&P500 with the indicator in the lower panel.
Figure 1. S&P500/ weekly
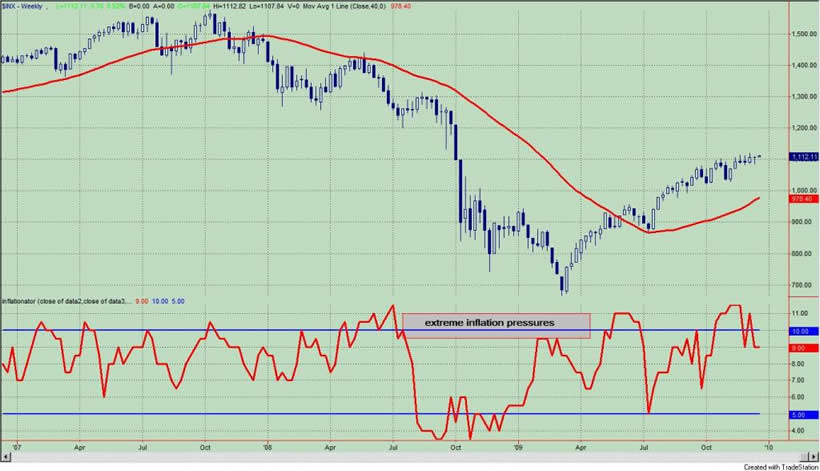
Although the value is not in the extreme zone, it still remains high. Of further note is the recent "saw tooth" pattern seen in the indicator. One week it is up and next week it is down; this is not typical. However, this pattern was last seen in late 2003 leading up to the January, 2004 immediate term market top. See figure 2. a weekly chart with the indicator in the lower panel.
Figure 2. S&P500/ weekly
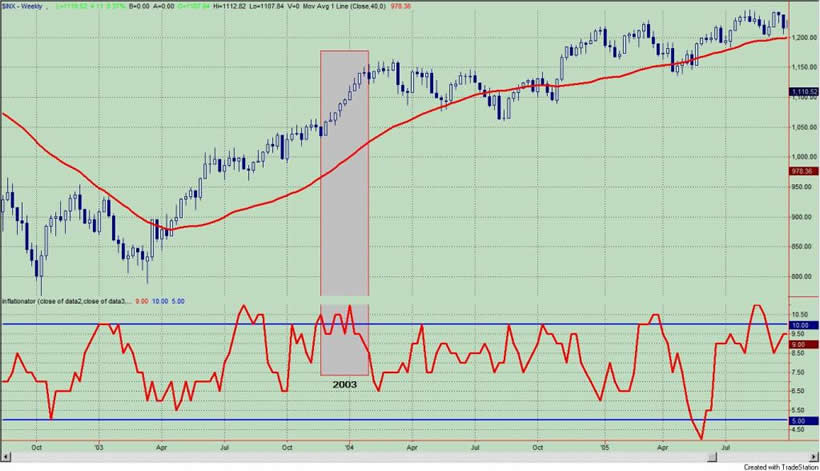
Similarities between the current market environment and that one are well documented: 1) the equity markets were on a tear from March to December; 2) the Dollar Index was in a protracted down trend over the same time period; 3) the Dollar was undergoing a contra-trend rally in early January, 2004, and it appears the Dollar Index is starting another short term rally here.
Like year end 2003, I have been starting to see many technical similarities, such as the clustering of negative divergences. Back in 2003, this pattern led to a blow off and the intermediate term top in January, 2004. This is the outlier trade that I have been referring to for the past several weeks.
By Guy Lerner
http://thetechnicaltakedotcom.blogspot.com/
Guy M. Lerner, MD is the founder of ARL Advisers, LLC and managing partner of ARL Investment Partners, L.P. Dr. Lerner utilizes a research driven approach to determine those factors which lead to sustainable moves in the markets. He has developed many proprietary tools and trading models in his quest to outperform. Over the past four years, Lerner has shared his innovative approach with the readers of RealMoney.com and TheStreet.com as a featured columnist. He has been a regular guest on the Money Man Radio Show, DEX-TV, routinely published in the some of the most widely-read financial publications and has been a marquee speaker at financial seminars around the world.
© 2009 Copyright Guy Lerner - All Rights Reserved
Disclaimer: The above is a matter of opinion provided for general information purposes only and is not intended as investment advice. Information and analysis above are derived from sources and utilising methods believed to be reliable, but we cannot accept responsibility for any losses you may incur as a result of this analysis. Individuals should consult with their personal financial advisors.
Guy Lerner Archive |
© 2005-2022 http://www.MarketOracle.co.uk - The Market Oracle is a FREE Daily Financial Markets Analysis & Forecasting online publication.