


ETF's To Buy, Sell, or Hold
Stock-Markets / Exchange Traded Funds Dec 10, 2009 - 09:29 PM GMTBy: Guy_Lerner

 As price weighs heavy in my market analysis, I always look for methods that quantify the price action. For example, when XYZ stock goes up 3 days in a row, I want to know what does that may mean (if anything) for the future price of that stock? In my work, I have explored the significance of divergences between prices and oscillators used to measure price. Divergences are often associated with market turning points.
As highlighted in several recent articles, we are starting to see a clustering of negative divergences in many of the assets and ETF's that I follow. This is to be expected as the market has been running on fumes for the past two months, and negative divergences are just emblematic of slowing upside momentum. The market doesn't have to roll over, but there is a high likelihood that it could. This is why I have suggested that readers sell something. Anything. It's good insurance. Risks are high that hard earned gains could be lost quickly. If you sell now, you can always buy it back later.
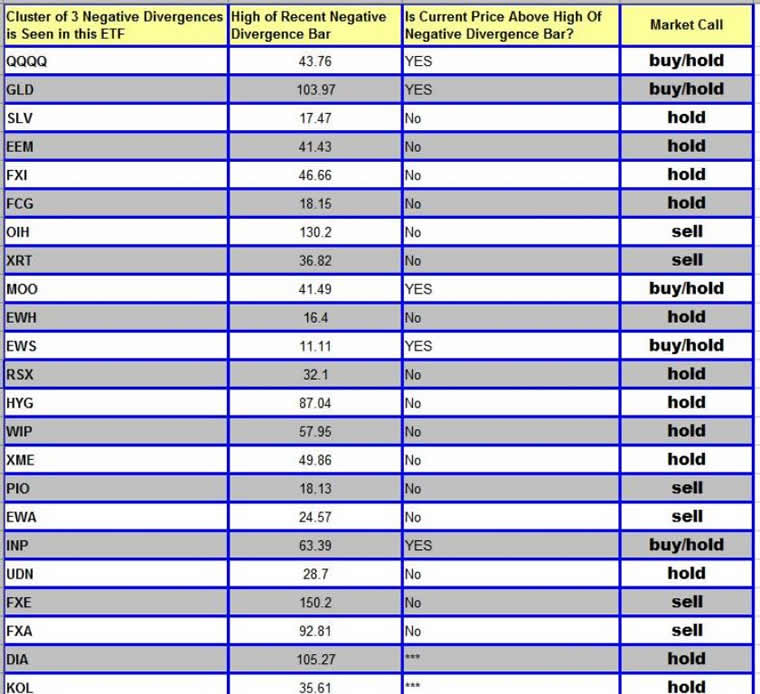
Over the past 3 weeks, I have compiled a list of ETF's that have a clustering of negative divergences. These are presented in Table 1. Of the 21 ETF's on this list, only 5 are currently (as of Thursday's closing price) trading above the highs of the recent negative divergence bar.
Table 1. ETF's/ Negative Divergence Bars
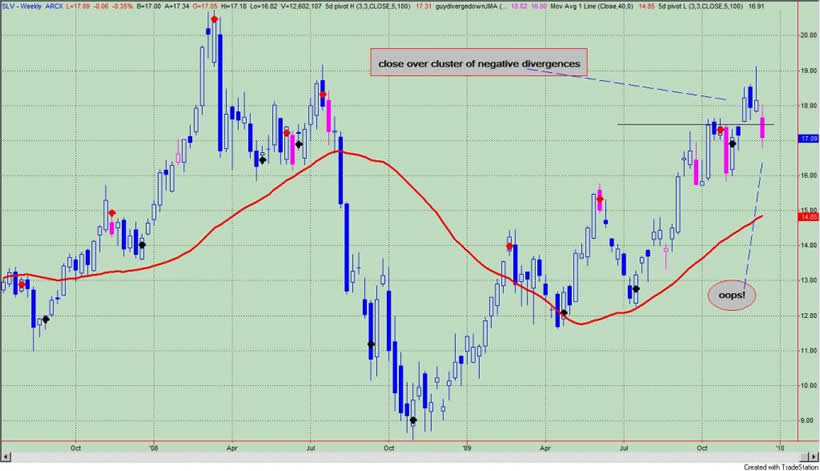
The i-Shares Silver Trust Fund (symbol: SLV) deserves a special mention. See figure 2 a weekly chart; negative divergence bars are marked in pink. 6 weeks ago SLV met the criteria for a clustering of negative divergence bars; a weekly close above the high of the most recent negative divergence bar saw prices shoot some 10% higher in 3 weeks - a strong move, but not quite parabolic. Over the past 2 weeks, all these gains have been lost somewhat precipitously and prices are back below the highs of the negative divergence bar. SLV is a couple of bad days from rolling over for good.
Figure 2. SLV/ weekly
I have updated Table 1 as there are 2 new ETF's to add to our list: DIA and KOL.
Lastly, I am going to put some market "calls" -i.e., I am going to put my neck on the market chopping block - to these insights, and this is in the last column of the table.
A "buy/ hold" signal would be for those ETF's that have already closed above the highs of the recent negative divergence bar on a weekly basis. Because this has happened, there is the possibility that prices could accelerate higher; however, like SLV, these gains (if ever realized) will likely be given back. This trade is for the nimble.
A "hold" signal implies a trading range, and this is likely to change in time.
A "sell" signal is a sell signal. At best expect (or hope for) a trading range; more likely, an opportunity to buy at lower prices is ahead. How far the sell off goes is yet to be determined.
By Guy Lerner
http://thetechnicaltakedotcom.blogspot.com/
Guy M. Lerner, MD is the founder of ARL Advisers, LLC and managing partner of ARL Investment Partners, L.P. Dr. Lerner utilizes a research driven approach to determine those factors which lead to sustainable moves in the markets. He has developed many proprietary tools and trading models in his quest to outperform. Over the past four years, Lerner has shared his innovative approach with the readers of RealMoney.com and TheStreet.com as a featured columnist. He has been a regular guest on the Money Man Radio Show, DEX-TV, routinely published in the some of the most widely-read financial publications and has been a marquee speaker at financial seminars around the world.
© 2009 Copyright Guy Lerner - All Rights Reserved
Disclaimer: The above is a matter of opinion provided for general information purposes only and is not intended as investment advice. Information and analysis above are derived from sources and utilising methods believed to be reliable, but we cannot accept responsibility for any losses you may incur as a result of this analysis. Individuals should consult with their personal financial advisors.
Guy Lerner Archive |
© 2005-2022 http://www.MarketOracle.co.uk - The Market Oracle is a FREE Daily Financial Markets Analysis & Forecasting online publication.