Natural Gas Outlook 2010
Commodities / Natural Gas Dec 09, 2009 - 10:09 AM GMTBy: Hans_Wagner
 The outlook for natural gas remains negative as the supply of the fuel outstrips demand. This situation will remain in place throughout the 2009-2010 heating season, unless the U.S. experiences an extremely cold winter. The earliest this situation will change will be during the 2010 - 2011 heating season, when available supply might be lower. Until then investors should tread carefully when considering the natural gas market.
Natural Gas Demand
According to the Energy Information Agency (EIA) the natural gas outlook predicts decline in total natural gas consumption to decline by 1.3 percent in 2009 followed by an increase by 0.6 percent in 2010 (Total U.S. Natural Gas Consumption Growth). Growth due to weather related use in the residential and commercial sectors in 2009 cannot overcome the current economic weakness in the industrial and electric power sectors. Consumption in the industrial and electric power sectors is expected to decline by 5.1 and 1.0 percent, respectively, in 2009. Consumption growth in 2010 remains largely dependent upon the timing and pace of economic recovery. Based on current assumptions, 2.2-percent growth in the electric power sector combined with slight growth in the residential and industrial sectors are all expected to contribute to 2010 consumption growth.
Included in the natural gas outlook, prices could remain low over the next few years as new coal-fired electricity plants open, reducing the overall amount of the natural gas used to generate power. According to Jen Snyder of Wood Mackenzie, when these new plants come online, demand for natural gas could rise sharply as older coal-fired plants are retired and government policies show a greater preference for cleaner energy sources.
In her view, prices could even spike to $10 per million British Thermal Units in the 2013-2014 timeframe, as producers are unable to keep up, before falling back to the $6.50 range after that period.
Winter weather is the leading factor in natural gas demand. Cold winters lead to use of more gas. Warmer winters reduce demand.
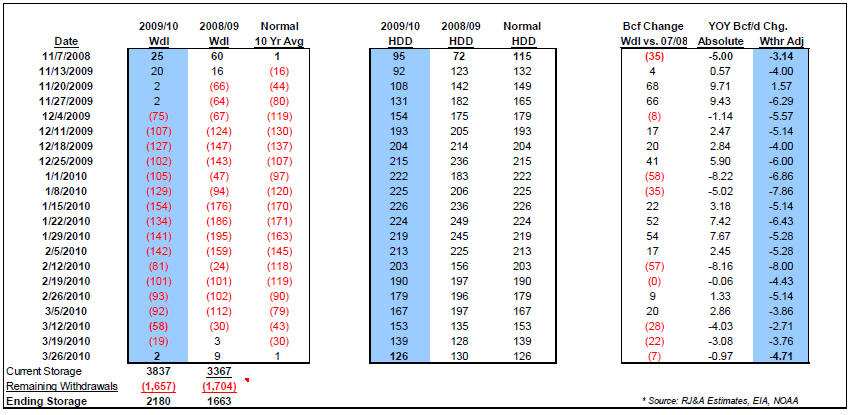
For example, the Oceanographic and Atmospheric Administration (NOAA) reported that there were 130 TDDs, or Total Degree Days (2 of which were CDDs, or Cooling Degree Days) during the week ending November 28. This was 19% below normal levels and 29% below last year. This warmer weather caused the use of natural gas to be much lower than in past years.
Colder weather in December will drive up demand. What is important to follow is how long the cold weather will last and whether the temperatures are average, below average or above average.
Using NOAA weather factors and EIA historical withdrawal rates, Raymond James developed the natural gas outlook tables below showing expected withdrawal rates. If this forecast turns out to be right, the U.S. will end up with substantially more gas still in storage than in prior periods. Should the winter of 2009 – 2010 be colder than expected, the withdrawal rates will raise accordingly.

Natural Gas Supply
According to the EIA, with so much gas in storage the outlook for natural gas annual production in 2010 is expected to decline relative to 2009 in the Federal Gulf of Mexico and Lower-48 non-Gulf of Mexico by 6.3 and 0.6 percent, respectively.
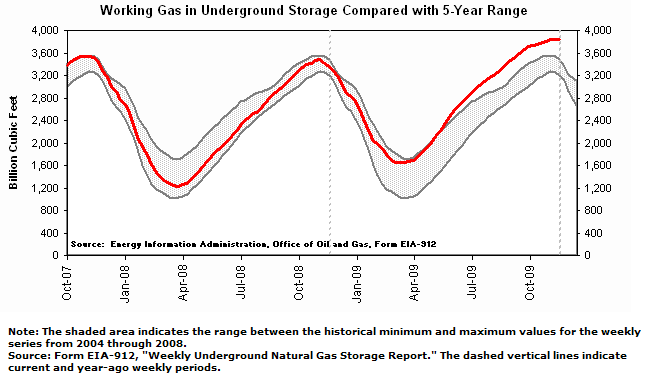
For the week ending November 28, 2009, the EIA reported that natural gas in U.S. storage facilities increased by 2 Bcf. Working gas in storage now totals 3,837 Bcf versus 3,367 Bcf in storage last year. The y/y storage surplus of 404 Bcf increased by 66 Bcf to 470 Bcf.
The EIA publishes a weekly report of the natural gas in storage. Working gas in storage was 3,837 Bcf as of Friday, November 27, 2009, according to EIA estimates. This represents a net increase of 2 Bcf from the previous week. Stocks were 470 Bcf higher than last year at this time and 487 Bcf above the 5-year average of 3,350 Bcf. In the East Region, stocks were 168 Bcf above the 5-year average following net withdrawals of 7 Bcf. Stocks in the Producing Region were 243 Bcf above the 5-year average of 976 Bcf after a net injection of 8 Bcf. Stocks in the West Region were 76 Bcf above the 5-year average after a net addition of 1 Bcf. At 3,837 Bcf, total working gas is above the 5-year historical range.
As shown in the chart from the EIA, Working Gas in Underground Storage Compared with 5-Year Range was well above the range.

Producers, due to voluntary shut-ins, completion delays, and pipeline/gathering constraints, have been reducing supply for several months. Since storage capacity is at an all time high, recent injections have been low. With gas prices around the $5.00 area, we should expect production to pick up as withdrawal rates increase. It is difficult to determine how much production will return, though it will tend to offset the withdrawal rates.
Prices
Price decreases leading up to Thanksgiving reflected the usual decrease in demand that generally occurs during a holiday week. A decrease in industrial demand and milder-than-normal temperatures in some areas of the country also drove price down. According to Bentek Energy, LLC, total U.S. demand dipped during the Thanksgiving holiday and demand in all regions was lower than the week prior. Demand for natural gas has been slow to recover, although the onset of colder weather will encourage space-heating demand, according to Bentek. The Henry Hub spot price is expected to average $5.01 per Mcf in 2009 and $5.93 per Mcf in 2010.
Contributing to the natural gas outlook, the price disparity between natural gas and oil has widened, leading some to believe that there is a natural upward pressure on natural gas. Part of the reason oil is experiencing higher prices is from the growing demand from emerging economies. While North America has an overabundance of natural gas, it is difficult and costly to export. Therefore, the market for gas remains within the continent. The relative price of natural gas to oil is changing as the dynamics of demand for oil are changing. We should not depend on the relationship to drive the price of gas in the future. Substituting natural gas for oil requires substantial capital investment. Following government policy, the focus is to bypass natural gas as a fuel for transportation and go directly to electricity. The T. Boone Pickens plan to use natural gas, as an interim fuel while the infrastructure to use electricity is deployed is not working out as he expected.
Shorter term, the following is a possible scenario for natural gas outlook over the next year or two. The large increase in proved reserves has come from shale gas using hydraulic fracturing and horizontal drilling. Natural gas produced from shale can lose as much as 50% of its production rate in one year. To maintain the same level of production natural gas producers must drill more wells than other formations. With the high levels of storage, producers have curtailed their drilling programs. As a result, they will experience lower production within the next year. This means production will taper off in the spring to summer of 2010. If companies do not pick up their drilling in the middle of 2010, available supply will not come online to recharge storage. this could lead to an increase in prices as supply fails to reach prior levels, meaning the earliest natural gas prices can make a comeback is late 2010.
Until then the price of natural gas will remain under pressure as supply exceeds demand. Therefore, investing in the natural gas ETF (UNG) will not prove viable until next summer at the earliest as investors begin to realize that the supply will not reach 2009 levels.
By Hans Wagner
tradingonlinemarkets.com
My Name is Hans Wagner and as a long time investor, I was fortunate to retire at 55. I believe you can employ simple investment principles to find and evaluate companies before committing one's hard earned money. Recently, after my children and their friends graduated from college, I found my self helping them to learn about the stock market and investing in stocks. As a result I created a website that provides a growing set of information on many investing topics along with sample portfolios that consistently beat the market at http://www.tradingonlinemarkets.com/
Copyright © 2009 Hans Wagner
Hans Wagner Archive |
© 2005-2022 http://www.MarketOracle.co.uk - The Market Oracle is a FREE Daily Financial Markets Analysis & Forecasting online publication.


