Shanghai’s Stock Market Not A Bubble, SSE Targets 4000
Stock-Markets / Chinese Stock Market Dec 08, 2009 - 02:19 PM GMTBy: Andrew_Butter
 The talk about a bubble in China that was all over the place in July and August appears to be subsiding. I confess I know practically nothing about China. But what I know has always made me wary, it still does.
What I bring to the debate is simply that I claim to know something about bubbles, and although many people think I am a simple minded village idiot, my initial attempts at applying my models to the real world did at least give the right answer (the model predicted in January that the S&P 500 would bottom at 675 and that the rally would go up at least until the DOW hit 10,000).
OK two out of two on stock markets could be nothing more than luck, and my view that gold was (is) a bubble and that it would at some point head down to $600 looks right now about as dumb as Nouriel Roubini’s quip about a dead-cat-sucker-rally on 14th March.
The other day I noticed a paper flagged up by Zero Hedge about China and the possibility of a bubble:
http://zerohedge.blogspot.com/2009/07/chinese-stock-bubble-watch-for-critical.html
The paper is about the work of Diddier Sornette which as far as I gould understand is something about Chaos Theory and attempts to model the inflection point of bubbles based on the characteristics of the patterns of daily stock movements. Apparently the methodology was used successfully to predict the inflection point of the US housing bubble and the recent oil bubble although I have so far been unable to find a reference to that.
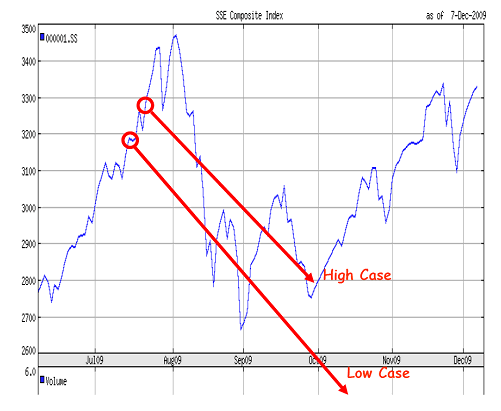
Their prediction made on 19th July was that the Shanghai Index would reverse, suddenly between July 17-27 and from looking at their chart go down to between 2,400 and 2,800.
I must say that they were bold; one of the first things I learnt from my recent initiation into the “predictions” business is that you never put both a number and a date.
This is what Zero Hedge had to say about that at the time:
Expanding on Cornelius' early piece on China, here is an analysis out of some BNP quants who for one reason or another are convinced the end's in sight. For those who are forgot where they put their Ritalin, here is the punchline:
This is what happened:

I’d say that regardless of where the analysts put their Ritalin, that was a pretty good result; I’d be interested to see where they say it’s going to go next.
But I don’t think that was a bubble popping:
My simple minded idea about bubbles is that they happen when market participants lose sight of fundamental value.
That can be caused by too much credit which allows “early adopters” to borrow money at “X”, buy assets at “Y” and then when what they can sell the asset for (to someone dumber than them), is a lot more than “X+Y”, they make lots of money (assuming they dump before the pump starts cavitating).
Another reason is if market participants convince themselves that the object of their affections has magical powers (when in reality that is not true). The Dot.com bubble was an example of that (aided by cheap credit), at that time the accepted method of valuation of a start-up was the summation of the inside leg measurement of the CEO raised to the power of “X”, which in time was proved to be an unreliable approach to doing valuation.
But that process historically has been long term, over at least six months maybe six years, not six weeks.
Also typically you don’t get the object of the bubble, going back to about the level that it popped within three months, when a bubble pops that’s it for a while.
So while I think that analysis looks pretty interesting (and I know that in my lifetime I will never fully understand how it works any more than I understand how the General Theory of relativity works), I don’t think it’s about bubbles.
The importance of valuation in understanding bubbles:
The way I look at bubbles, is first to try and figure out what the “fundamental value” of whatever it is that is supposedly bubbling is. Some people (Smithers, Tobin, Shiller) call that “Fair Value”, International Valuation Standards calls it Other-Than-Market-Value (OMV).
If you know that then you at least know by how much the market got distorted by the whatever it was that caused the bubble, and you also know that the more the distortion, the harder the fall will be, when the thing pops.
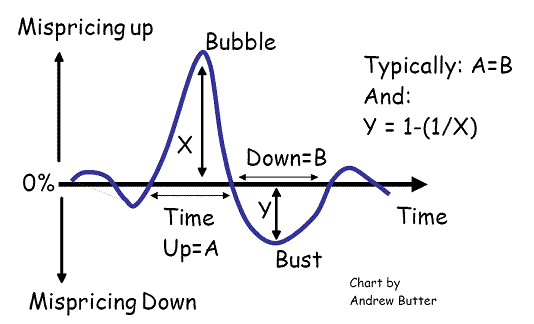
One of the main things I think I figured out is that in many bubbles, particularly for assets that are fundamentally useful (housing and stocks rather than tulips), the dip below the “fundamental” (OMV) is typically predicated by how much the market was distorted in the bubble; also the period of time that the market takes to get back to the OMV after the pop, is pretty much predicated by the preceding period of time there was a bubble.
That idea is summarised in this sketch:

The analogy that I have is that a bubble is like a pebble thrown into a still pond, and the up-wave (the bubble) is reflected in the down-wave (the bust) that follows:
I talk about that in more detail in:
http://www.marketoracle.co.uk/Article12114.html
http://www.marketoracle.co.uk/Article15041.html
The problem with China
The problem with China is that I have no idea how to work out what the fundamental value (OMV) should be.
The reason is that there just isn’t enough history, or perhaps there is.
Either way, in USA the stock market “fundamental” (i.e. the OMV) appears to track nominal GDP divided by long-term interest rates (LTIR), so perhaps it’s the same in China.
Not that I particularly believe the reported numbers for GDP and I have not clear idea about what long term interest rates are applicable, still that’s a start. Anyway assuming for the moment that perhaps LTIR (whatever they are), didn’t change much, the “fundamental “ought” to track nominal GDP if the Shanghai Index is a good proxy for what’s happening in China (and I have no opinion about that either – just a hypothesis).
(You can understand why I’m often called a village idiot; I basically don’t have much of an opinion on just about everything, a sort of Anti-Renaissance Man).
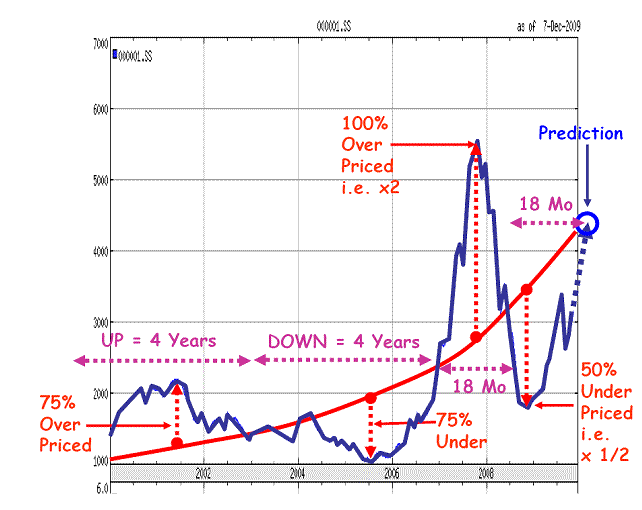
This is how it looks:

Based on that analysis my conclusion is:
1: If you believe the GDP numbers being put out by the Chinese government then the Shanghai Index is not a bubble right now, rather the reverse, it is a market in the process in recovering from a bubble that popped in late 2008.
2: Markets in recovery are the safest to invest in, there was one “after-shock” so far, expect two more before OMV is reached (a word of warning for the day-traders).
3: The opinion of this crystal-ball-peering village idiot is that the Index will go up to above 4,000 (could be 4,500) within six months.
4: Given that I don’t like gold (I think I must be allergic to it), I haven’t looked hard in a while by my impression is the S&P 500 will be lucky to drift sideways over the next six months, and I think long to medium term US Treasuries are a bubble (i.e. 10 Year and 30 year yields are set to go up, perhaps suddenly), putting something into the Shanghai Index would probably be a better bet than keeping money under the mattress.
By Andrew Butter
Twenty years doing market analysis and valuations for investors in the Middle East, USA, and Europe; currently writing a book about BubbleOmics. Andrew Butter is managing partner of ABMC, an investment advisory firm, based in Dubai ( hbutter@eim.ae ), that he setup in 1999, and is has been involved advising on large scale real estate investments, mainly in Dubai.
© 2009 Copyright Andrew Butter- All Rights Reserved
Disclaimer: The above is a matter of opinion provided for general information purposes only and is not intended as investment advice. Information and analysis above are derived from sources and utilising methods believed to be reliable, but we cannot accept responsibility for any losses you may incur as a result of this analysis. Individuals should consult with their personal financial advisors.
Andrew Butter Archive |
© 2005-2022 http://www.MarketOracle.co.uk - The Market Oracle is a FREE Daily Financial Markets Analysis & Forecasting online publication.


