


Stock Market Short-term Rally More Probable than a Decline
Stock-Markets / Stock Index Trading Dec 06, 2009 - 07:40 PM GMTBy: Andre_Gratian

 Current Position of the Market
SPX: Long-term trend - Down! The very-long-term cycles have taken over and if they make their lows when expected, the bear market which started in October 2007 should continue until 2014. This would imply that
much lower prices lie ahead. As illustrated by the current market performance, this will not be a straight-down
decline, but will consist of a series of intermediate-term rallies and declines until we have reached the low
point.
SPX: Intermediate trend - The 6+ weeks period of consolidation looks as if it may have ended at 1084. The index made a new high at 1119, but it is encountering stiff resistance which is making further progress difficult.
Analysis of the short-term trend is done on a daily basis with the help of hourly charts. It is an important adjunct to the analysis of daily and weekly charts which determines the course of longer market trends.
Daily market analysis of the short term trend is reserved for subscribers. If you would like to sign up for a FREE 4-week trial period of daily comments, please let me know at ajg@cybertrails.com .
Overview:
If the dollar has reversed its downtrend -- which remains to be confirmed -- the SPX is going to have difficulty reaching 1130 or so which I had forecast for the top of this move. But the sentiment indicator which I follow is only neutral and gives me hope that we could still see that level reached. Short-term cycles which just made their lows Friday also should help
Another principal obstacle to any further progress by the index is the long-term downtrend line from the 2007 top. Prices have been straddling it for almost 2 months and have been unable to close above it decisively. That’s if you draw your chart to an arithmetic scale! If you draw it to a log scale, the trend line would be at about 1134 on the 21st. That would be consistent with the Fibonacci projection.
Theoretically, if we did close above that long term downtrend line, we should confirm a long-term reversal, putting the index back in a long-term uptrend. But that would be true only if there is a good follow-through afterwards. It’s something to keep in mind, but with the 4-yr cycle due to bottom in 2010, it’s unlikely that March 2009 was a major low. Most likely, we are near an intermediate top and, judging by the behavior of the A/D, the market is tired.
The consolidation that we just made could be part of a topping pattern from which there could be a false break-out incapable of being sustained and followed by an important reversal which could take us well into next year. Four years from the last four year cycle bottom falls in August 2010. Declining into that time frame to complete the current four-year cycle phase is one possibility! Also, the next 4-year cycle would bottom in 2014, which is when the 120-year cycle is due along with all its major components.
There were several minor cycles due to nest on Friday. They could have been responsible for bringing the index down at the close of Thursday. One more was due either at the close of Friday or first thing Monday morning. We should get a hint of what the SPX intends to do at the opening from Sunday’s Globex report.
The Russell 2000 was strong on Friday, and closed strong. This index had been much weaker than large cap indices during the consolidation. It appears to want to start a 5th wave. That would be interesting if true! It could put off the top until later than expected with a higher objective than given for the SPX. Most likely, this is only a “c” wave which will fail to make a new high.
What's ahead?
Chart Pattern and Momentum
On the Weekly Chart, the two things which are most apparent is 1) that we have arrived at the major trend line, and 2) that the indicators show a good amount of price deceleration with negative divergence having formed in the lower one. The 3-4 weeks of consolidation which the index has just undergone may result in an attempt at moving through the trend line, but unless the upside momentum can be recaptured, we are likely to have a failed break-out attempt followed by an intermediate downtrend.
To confirm a downtrend, the SPX must first close below the red horizontal line (1028), and then break out of its rising channel.
The Daily chart, below is giving mixed signals. The second indicator (MSO) is still declining, but the bottom one (A/D) has begun to rise. I would give more credibility to the latter, and expect another (limited) attempt at continuing the uptrend. The current dilemma is caused by minor cycles which we will discuss under that heading.
The price move from March has been contained within a larger channel (green dashes), which can be broken down into two smaller (black) channels. The deceleration of the entire trend is evidenced by the inability of the index to move to the top of both channels.
Longer-term, the strength of the move is reflected by the fact that prices have remained in the top part of the main channel. However, the obvious deceleration is telling us that the advance is weakening. At this point, the SPX can either regain its upside momentum, or begin to roll over and trade below its MAs. The A/D indicator is signaling a potential attempt at resuming the uptrend. I will discuss why I favor that possibility for the short term under cycles and projections.
The Hourly Chart shows how, on Friday, the index briefly made a new high, but could not maintain it. It has pulled back because it met resistance at the red trend line extension and in conjunction with minor cycles. The last one of these may have bottomed late Friday, or will do so on Monday morning.
If we open weak on Monday, it is because the cycle has about 5 more hours to complete its bottoming process. If strong, it’s because it has already bottomed on Friday. There is some disagreement between the daily and the hourly chart, so we’ll have to let the market tell us which of the two is correct. It’s not a big deal if we break below the highest of the two black channel lines. It would be if we closed outside the lower of the two. The rally at the close on Friday did not quite get the index above its moving averages. Unless we can get above them at the opening, we’ll look for additional retracement.
Cycles
The most important cycle affecting the market at this time is probably the 4-year cycle which should be topping for a low in the Fall, next year. We have not reversed yet, and the minor cycles bottoming in this time frame should cause one more rally attempt before we roll over.
Note that I have place one cycle (red asterisk) at the top of Friday’s high. I believe that’s where it belongs, and that it was an inversion of that cycle, something which could not be predicted ahead of time because it was in a cluster with the other cycles. That cycle has a tendency to alternate between highs and lows, though not on a regular basis. You would have to go to August 7 to find an example of the last time it called a good high.
The most important cycle now is the 13-day cycle. As mentioned above, the daily chart says that it could have bottomed Friday, the hourly calls for a low on Monday. The market will have to decide and we have to wait until Monday morning, or we might get a clue from the Globex later today.
And then, we have to sort out the elusive 20-week cycle which was supposed to ideally have made its low on 12/11, but could have made it early (as Carl Swenlin suggests) and therefore is no longer a factor. Again, market behavior will clear it up!
Until then, we’ll have to use conventional TA, and the dollar behavior to determine the short-term trend.
Projections:
For some time, I have talked about a potential Fibonacci projection around 1135 to mark the end of the move from the March low. Refining this target from various lows gives us two targets at 1129. If we wait for the bottoming of the 13-day cycle and, assuming it brings in a new high after its low, we might get a more accurate projection.
On the Point & Figure chart, the SPX made a base from 10/30 to 11/03 which gives us a conservative potential count for the next top of 1120 to 1127. This is probably one of the reasons that we saw profit-taking when the SPX touched 1119.13 on Friday. The higher count of 1127 would be more consistent with the Fibonacci projection. P&F counts are considered approximate, but are often right on target.
Breadth
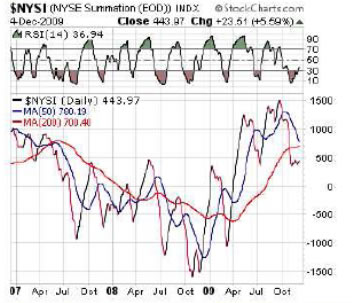
There has been little change in the NYSE Summation index (courtesy of StockCharts) in the past two weeks. The fact that it is still oversold suggests that we may be more likely to have a rally than to decline further, and it may help the SPX hold the 1085 level.
Market Leaders and Sentiment
There was an attempt on Friday by the Russell 2000 to regain its upside momentum. If it does so over the next couple of weeks, it could delay the intermediate reversal which is expected soon.
Another indicator which argues against an imminent top is the sentiment indicator (courtesy of SentimenTrader) which does not have a negative enough reading. As far as I know, the only way that this indicator could get more negative is by the market going higher. I will not be able to show it today because of the limited abilities of my crippled capture software, but both the short-term and longer term readings are essentially neutral.
The US$ is also going to be a factor in the timing of the top formation. On Friday, it made its best attempt yet at breaking out of its declining trend. If it requires more base-forming, it will give the SPX a chance to put the final touch on its topping action.
Summary
This is what I wrote two weeks ago: “Mixed signals continue to warn us of a near, but not imminent end to the March 2009 rally.” I think that I will leave it at that for this time also.
The SPX has a potential projection to 1128-30 which could be met before we see the end of the move.
The following are examples of unsolicited subscriber comments:
Awesome calls on the market lately. Thank you. D M
Your daily updates have taken my trading to the next level. D
… your service has been invaluable! It's like having a good technical analyst helping me in my trading. SH
I appreciate your spot on work more than you know! M
But don't take their word for it! Find out for yourself with a FREE 4-week trial. Send an email to ajg@cybertrails.com .
By Andre Gratian
MarketTurningPoints.com
A market advisory service should be evaluated on the basis of its forecasting accuracy and cost. At $25.00 per month, this service is probably the best all-around value. Two areas of analysis that are unmatched anywhere else -- cycles (from 2.5-wk to 18-years and longer) and accurate, coordinated Point & Figure and Fibonacci projections -- are combined with other methodologies to bring you weekly reports and frequent daily updates.
“By the Law of Periodical Repetition, everything which has happened once must happen again, and again, and again -- and not capriciously, but at regular periods, and each thing in its own period, not another’s, and each obeying its own law … The same Nature which delights in periodical repetition in the sky is the Nature which orders the affairs of the earth. Let us not underrate the value of that hint.” -- Mark Twain
You may also want to visit the Market Turning Points website to familiarize yourself with my philosophy and strategy.www.marketurningpoints.com
Disclaimer - The above comments about the financial markets are based purely on what I consider to be sound technical analysis principles uncompromised by fundamental considerations. They represent my own opinion and are not meant to be construed as trading or investment advice, but are offered as an analytical point of view which might be of interest to those who follow stock market cycles and technical analysis.
Andre Gratian Archive |
© 2005-2022 http://www.MarketOracle.co.uk - The Market Oracle is a FREE Daily Financial Markets Analysis & Forecasting online publication.