


Stock Market Cross Currents
Stock-Markets / Stock Market Sentiment Dec 06, 2009 - 09:12 AM GMTBy: Guy_Lerner

 The trading range that has developed over the past several weeks is emblematic of the cross currents confronting this market. New highs seem to be made daily and then boom, the rug is pulled out from the market, and prices plunge for a couple of hours. Buyers appear and back to the highs we go and selling begins again. If you are looking for some support area where you might think it is "safe" to find a low risk entry, then this isn't the market for you. Sell offs are clearly unpredictable although they are occurring at the upper reaches of the trading zone that I had expected when I stated this over two months ago:
"If you intend to play on the long side, it will be important to maintain your discipline (for risk reasons) and buy at the lows of that trading range and sell at the highs to extract any profits from this market."
The usual cross currents remain: 1) an equity market divorced from the fundamentals; 2) diverging and weakening market internals; 3) highly bullish investor sentiment; and 4) strong trends in gold, 10 year Treasury yields, and crude oil. These are real headwinds and no doubt have contributed to this grinding price range we have seen.
But now we have a new wrinkle. On Friday, the Dollar and the equity market rose together. Friday's unemployment surprise appears to be the catalyst. The prior 6 months saw the "bad news is good news" trade as weakness in the economy meant increasing liquidity, continued Dollar devaluation, and higher stock prices. It was all good as long as there was bad news. This led some analysts to suggest prior to the employment report that the bulls better think about what they wish for. Good news may not be treated so kindly by Mr. Market. But good news was received well (at least for a few hours until new highs were made briefly).
Now one data point doesn't make a trend, but it does set the tone. The vibe I am getting is that "America is back". This is the way it is suppose to be. We have a strong economy and a strong Dollar. Wow, that was quick and painless. We have a stock market that has moved far ahead of itself on a fundamental basis and that has risen on a surge of liquidity, and in one day, I now have to start believing that we are going to continue this meteoric rise on improving fundamentals and without the support of the Federal Reserve. I am a bit skeptical.
I am even more skeptical after a 60% plus rise in the S&P500 over 8 months. Yet, wouldn't it be ironic if the market put in a top on the good news that "America is back"? Maybe this new wrinkle will be the reason for investors to come into this market and really blow the lid off this range?
Regardless, it would not surprise me to see stocks continue their grind higher on this theme of "America is back". It is the new antidote for all the negativity. Of course, we all know that is not the case, and this economy is a long ways from getting a good bill of health. This is a $13 trillion economy and like a cruise ship, it won't turn on a dime.
While the bullish rhetoric may be set to change, the excessive bullish sentiment suggests that investors will continue to "buy the dips". Only lower prices will change this behavior.
Lastly, as long as the trends in crude oil, 10 year Treasury yields, and gold remain strong, equities will be prone to sudden sell offs. See this link.
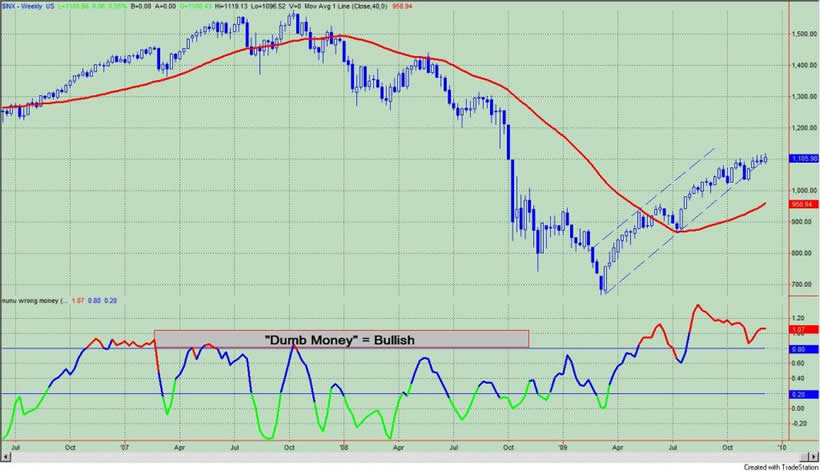
The "Dumb Money" indicator, which is shown in figure 1, looks for extremes in the data from 4 different groups of investors who historically have been wrong on the market: 1) Investor Intelligence; 2) Market Vane; 3) American Association of Individual Investors; and 4) the put call ratio. The "Dumb Money" indicator shows that investors are extremely bullish.
Figure 1. "Dumb Money" Indicator/ weekly
The "Smart Money" indicator is shown in figure 2. The "smart money" indicator is a composite of the following data: 1) public to specialist short ratio; 2) specialist short to total short ratio; 3) SP100 option traders. The Smart Money indicator is neutral.
Figure 2. "Smart Money" Indicator/ weekly
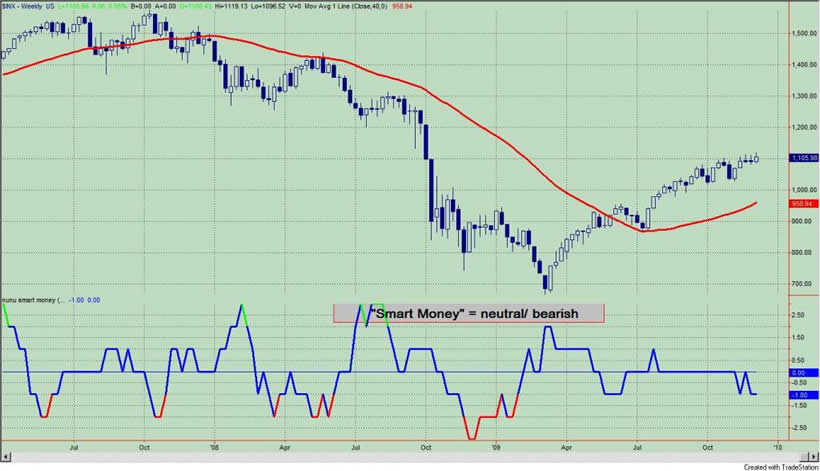
Figure 3 is a weekly chart of the S&P500 with the InsiderScore "entire market" value in the lower panel. From the InsiderScore weekly report we get the following two insights: 1) S&P500 insiders remain bearish; 2) outside of the financials, buyers are not showing the type of conviction that sellers are.
Figure 3. InsiderScore Entire Market/ weekly
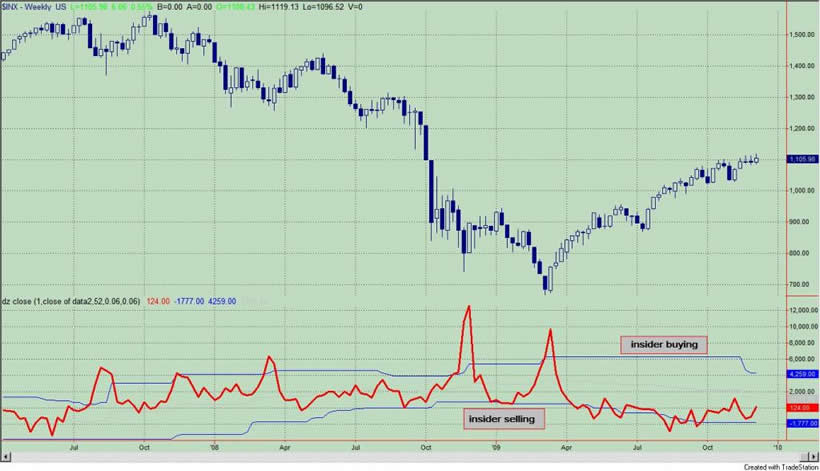
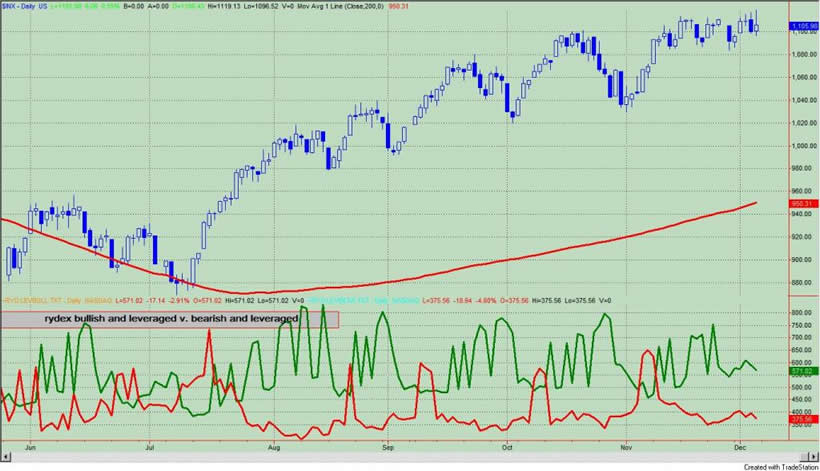
Figure 4 is a daily chart of the S&P500 with the amount of assets in the Rydex bullish and leveraged funds versus the amount of assets in the leveraged and bearish funds. Not only do we get to see what direction these market timers think the market will go, but we also get to see how much conviction (i.e., leverage) they have in their beliefs. Typically, we want to bet against the Rydex market timer even though they only represent a small sample of the overall market. As of Friday's close, the assets in the bullish and leveraged funds were greater than the bearish and leveraged and the current ratio is not particularly revealing; referring to figure 4, this would put the green line greater than red line.
Figure 4. Rydex Bullish and Leveraged v. Bearish and Leveraged/ daily
By Guy Lerner
http://thetechnicaltakedotcom.blogspot.com/
Guy M. Lerner, MD is the founder of ARL Advisers, LLC and managing partner of ARL Investment Partners, L.P. Dr. Lerner utilizes a research driven approach to determine those factors which lead to sustainable moves in the markets. He has developed many proprietary tools and trading models in his quest to outperform. Over the past four years, Lerner has shared his innovative approach with the readers of RealMoney.com and TheStreet.com as a featured columnist. He has been a regular guest on the Money Man Radio Show, DEX-TV, routinely published in the some of the most widely-read financial publications and has been a marquee speaker at financial seminars around the world.
© 2009 Copyright Guy Lerner - All Rights Reserved
Disclaimer: The above is a matter of opinion provided for general information purposes only and is not intended as investment advice. Information and analysis above are derived from sources and utilising methods believed to be reliable, but we cannot accept responsibility for any losses you may incur as a result of this analysis. Individuals should consult with their personal financial advisors.
Guy Lerner Archive |
© 2005-2022 http://www.MarketOracle.co.uk - The Market Oracle is a FREE Daily Financial Markets Analysis & Forecasting online publication.