Probability of a Stock Market Crash Is Rising
Stock-Markets / Financial Crash Dec 05, 2009 - 05:54 PM GMTBy: Brian_Bloom
 A new ball game?
In the past few weeks, this analyst has been taking the unpopular stance that the US Dollar Index might be wanting to bottom out. The sharp rise on Friday (chart courtesy yahoo.com) may or may not have been the start of a new move but it was certainly not a mild move in currency terms.
US DOLLAR INDEX (NYBOT:DX)
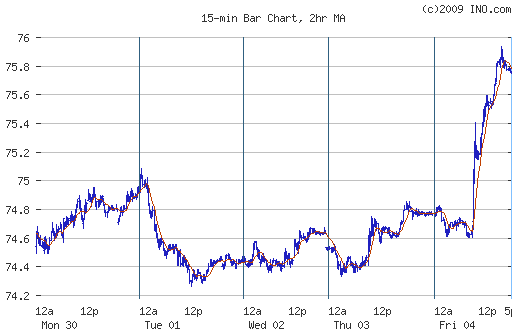
This move will have implications for the carry trade crowd. In particular, we might witness a capital crunch given that lenders to the carry trade might well be asking to have their loans repaid.
One chart that has stuck out as being worthy of focus is of the 30 year bond price (Courtesy Decisionpoint.com).
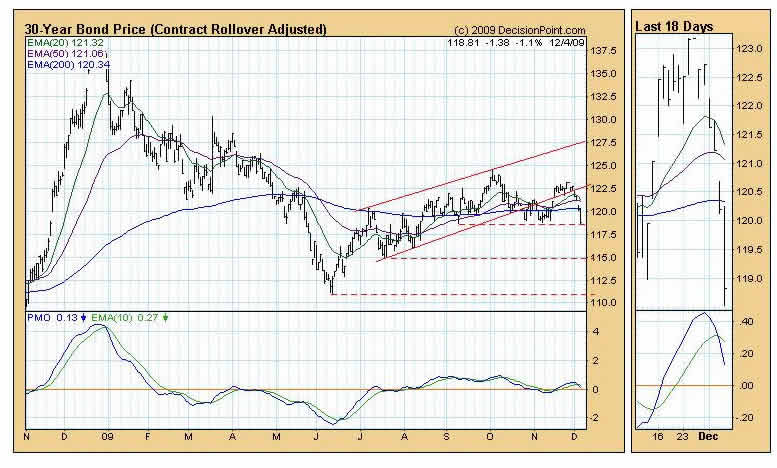
Note the Gap island reversal. At around 121-121.2 (Gap up in November, Gap down in December). This is a subtle pointer to the emotion that is now prevailing in the markets.
The immediate target destination for the down move in the 30 year bond price is 115.
From another perspective, the P&F chart below of the 30 year bond yield (courtesy stockcharts.com) is showing what might be a flag consolidation pattern within a rising trend.
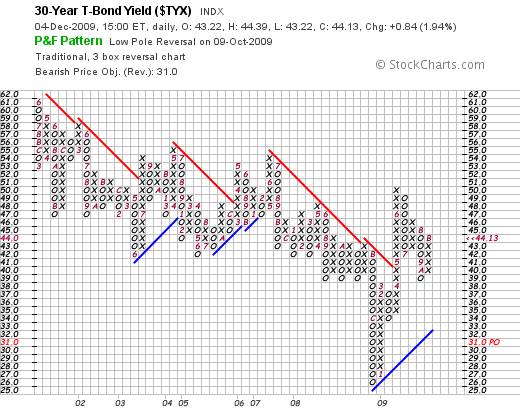
If the 115 downside target is met on the bond price chart – based on gap analysis and head-and-shoulders measured move – then the 30 year yield might rise as high as 5% based on the Point and Figure horizontal count.
Such a move will not be insignificant in context of the monthly chart below (courtesyDecisionPoint.com).
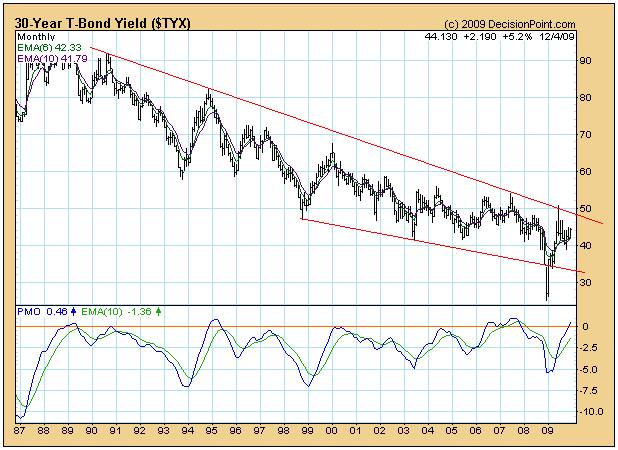
Indeed, if that level is reached, it will represent a minor break up from a 22 year down trend.
Could we be watching the emergence of a new ball game? Rising yields might underpin the US Dollar, but what will they do for equities?
The monthly chart below of the Dow Jones Industrial Index (courtesy BigCharts.com) is showing some worrying signs:
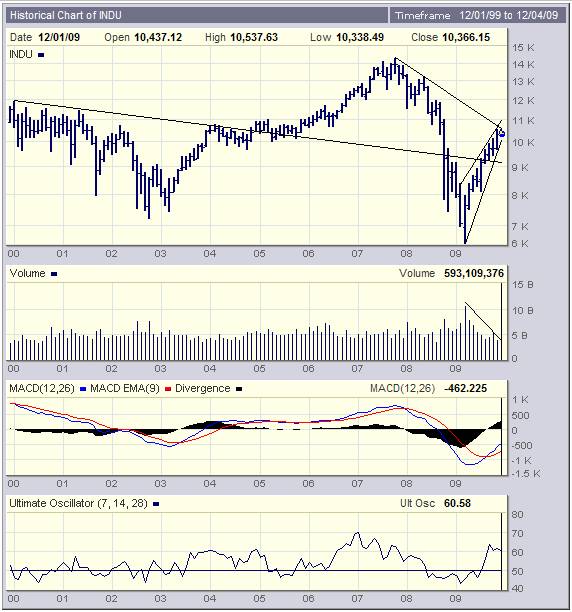
- The Index is reaching for the apex of a rising wedge
- The rising wedge occurred in context of falling volume (ie it was an absence of selling rather than a presence of buying that caused the index to rise)
- The Index is still below the level of the falling trend line which dates back to late 2007
- The Ultimate oscillator as turned down (falling tops)
What has been concerning this analyst for some months may be paraphrased by the following question: “If, after having watched the authorities throw trillions of dollars at the markets, investors witness a market that pulls back within a Primary Bear Trend, how will they react?”
Here is my fear: If the market fails to confirm that a new Primary Bull trend has been entered and, in the process, confirms that the move from March 2009 to the present has been a technical upward reaction in a Primary Bear Trend, then it is this analyst’s view that investors will begin to panic. A pull back will imply that the authorities have given it their best shot, and failed.
Conclusion
The next few weeks should clarify, from a technical perspective, whether the Primary Trend of the US equity market is still “down” or whether it is entering a new “up” phase.
Author’s note:
In context of one of the main themes of Beyond Neanderthal – that it is “energy” that drives the world economy – and in context of the Copenhagen talks likely to devolve to meaningless prattle about actions to be taken about the so-called crisis of climate change, few people will focus on the following fact: Climate Change has been an excuse. The real implication of taking strong action on Carbon Dioxide emissions would have been to provide an impetus to the move away from our reliance on fossil fuels and towards clean, “green” alternative energies; of which nuclear is not one. In 2005 the US Government quietly passed The Energy Policy Act. According to Wikipedia, (http://en.wikipedia.org/wiki/Energy_Policy_Act_of_2005 ) the Energy Policy Act:
Extends the Price-Anderson Nuclear Industries Indemnity Act through 2025;
· Authorizes cost-overrun support of up to $2 billion total for up to six new nuclear power plants;
· Authorizes a production tax credit of up to $125 million total per year, estimated at 1.8 US¢/kWh during the first eight years of operation for the first 6.000 MW of capacity;[7] consistent with renewables;
· Authorizes loan guarantees of up to 80% of project cost to be repaid within 30 years or 90% of the project's life [1];
· Authorizes $2.95 billion for R&D and the building of an advanced hydrogen cogeneration reactor at Idaho National Laboratory[2];
· Authorizes 'standby support' for new reactor delays that offset the financial impact of delays beyond the industry's control for the first six reactors, including 100% coverage of the first two plants with up to $500 million each and 50% of the cost of delays for plants three through six with up to $350 million each for [3];
· Allows nuclear plant employees and certain contractors to carry firearms;
· Prohibits the sale, export or transfer of nuclear materials and "sensitive nuclear technology" to any state sponsor of terrorist activities;
· Updates tax treatment of decommissioning funds;
· A provision for the U.S. Department of Energy to report in one year on how to dispose of high-level nuclear waste; “
That was four years ago. This year, on February 27th 2009, President Obama “dumped” the plan to use Yucca Mountain as the depository for high level nuclear waste. http://www.world-nuclear-news.org/newsarticle.aspx?id=24743 . There is no plan on how to dispose of high level nuclear waste. It is also of some significance that the US Government saw fit to extend the hand of support to a technology that has been around for nearly 60 years. That is the type of action one takes to support an emerging technology. Can nuclear fission be classified as an emerging technology?
Overall Conclusion
Our esteemed political leaders are thrashing around in the dark. Energy policy is being dictated by political expediency. Without a clear energy policy the foundations of a new phase of economic growth will not have been put in place. The “driver” of global economic growth will have been weakened. The probabilities of a market crash are rising
By Brian Bloom
Once in a while a book comes along that ‘nails’ the issues of our times. Brian Bloom has demonstrated an uncanny ability to predict world events, sometimes even before they are on the media radar. First he predicted the world financial crisis and its timing, then the increasing controversies regarding the causes of climate change. Next will be a dawning understanding that humanity must embrace radically new thought paradigms with regard to energy, or face extinction.
Via the medium of its lighthearted and entertaining storyline, Beyond Neanderthal highlights the common links between Christianity, Judaism, Islam, Hinduism and Taoism and draws attention to an alternative energy source known to the Ancients. How was this common knowledge lost? Have ego and testosterone befuddled our thought processes? The Muslim population is now approaching 1.6 billion across the planet. The clash of civilizations between Judeo-Christians and Muslims is heightening. Is there a peaceful way to diffuse this situation or will ego and testosterone get in the way of that too? Beyond Neanderthal makes the case for a possible way forward on both the energy and the clash of civilizations fronts.
Copies of Beyond Neanderthal may be ordered via www.beyondneanderthal.com or from Amazon
Copyright © 2009 Brian Bloom - All Rights Reserved
Disclaimer: The above is a matter of opinion provided for general information purposes only and is not intended as investment advice. Information and analysis above are derived from sources and utilising methods believed to be reliable, but we cannot accept responsibility for any losses you may incur as a result of this analysis. Individuals should consult with their personal financial advisors.
Brian Bloom Archive |
© 2005-2022 http://www.MarketOracle.co.uk - The Market Oracle is a FREE Daily Financial Markets Analysis & Forecasting online publication.


