Dow Stocks Index Expanding Triangle Bearish Price Pattern
Stock-Markets / Stock Index Trading Dec 03, 2009 - 05:44 PM GMTBy: Nadeem_Walayat
 My most recent in depth analysis of the stock market (02 Nov 2009 - Stocks Bull Market Forecast Update Into Year End) concluded with a projected rally for the Dow from 9712 to the target zone of 10,350 to 10,500, which on subsequent price action was fine tuned to 10,425 (Nov 2009 - Stocks Enter Correction Zone, Gold and Silver Next to Follow? ). This was achieved last week and was followed by a swift drop following the Dubai debt crisis implying that the correction towards the target zone of 9,900 to 9,950 was underway.
This week we have seen an early week rally to yet another Dow high breaking just above 10,500 to 10,512 to set a December high for the Dow and thus leaving far behind the October crash is coming crowd in the dust.
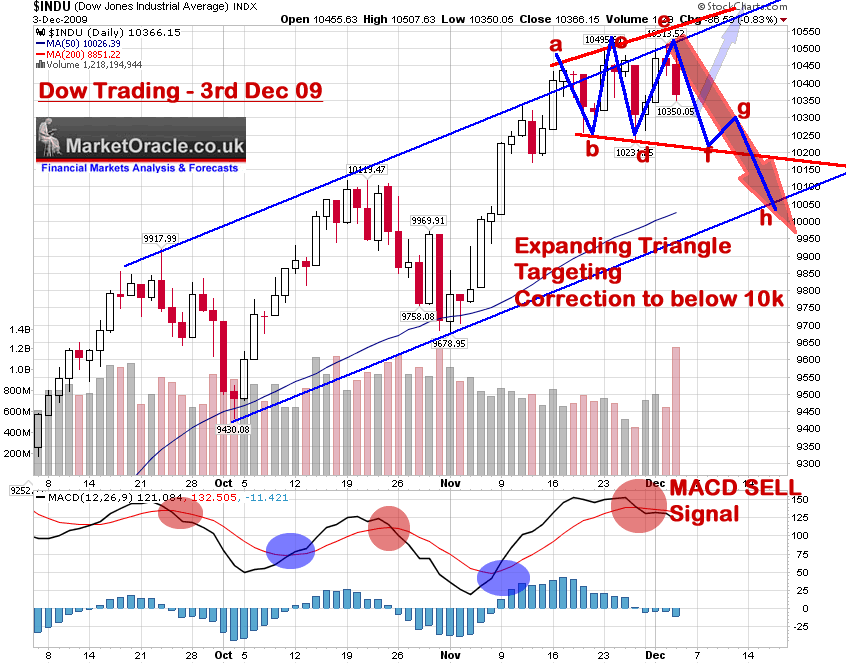
The chart pattern that has been unraveling over the past couple of weeks is now more clearly starting to resolve towards a more volatile expanding triangle which is usually associated with topping price pattern and therefore fits within the immediate future bearish scenario that calls for a 'normal' correction into mid December. Furthermore a measuring move by taking the lowest and higher points of 10,231 and 10513 generates 282 points which projects down to a target of 9,949 which is exactly inline with the original target range of 9,950 to 9,900 set several weeks ago.

The MACD cross additionally confirms a technical sell signal several days ago to further reinforce the correction scenario. Therefore given today's down close of Dow 10,366, and barring Unemployment Report volatility, the probability does favour an overall trend lower towards the expanding triangle support line, where it may bounce, but as I have indicated this is a bearish price pattern therefore probability should soon favour a break of this support trendline which would be inline with the scenario that is playing out.
The risk to the corrective scenario is that the Dow bounces strongly from the support line which would propel it higher towards a new high for the move. There also exists a far less probable alternative bullish possibility of a significantly higher low that attempts to break the bearish expanding triangle price pattern and therefore resulting in a far stronger end of year stocks rally.
In Summary, whilst the immediate future is subject to the usual volaility surroinding the U.S. Unemployment Report, however at this point analysis favours the normal correction to materialise which targets 9,950 to 9,900.
By Nadeem Walayat
http://www.marketoracle.co.uk
Copyright © 2005-09 Marketoracle.co.uk (Market Oracle Ltd). All rights reserved.
Nadeem Walayat has over 20 years experience of trading derivatives, portfolio management and analysing the financial markets, including one of few who both anticipated and Beat the 1987 Crash. Nadeem's forward looking analysis specialises on the housing market and interest rates. Nadeem is the Editor of The Market Oracle, a FREE Daily Financial Markets Analysis & Forecasting online publication. We present in-depth analysis from over 400 experienced analysts on a range of views of the probable direction of the financial markets. Thus enabling our readers to arrive at an informed opinion on future market direction. http://www.marketoracle.co.uk
Disclaimer: The above is a matter of opinion provided for general information purposes only and is not intended as investment advice. Information and analysis above are derived from sources and utilising methods believed to be reliable, but we cannot accept responsibility for any trading losses you may incur as a result of this analysis. Individuals should consult with their personal financial advisors before engaging in any trading activities.
Nadeem Walayat Archive |
© 2005-2022 http://www.MarketOracle.co.uk - The Market Oracle is a FREE Daily Financial Markets Analysis & Forecasting online publication.
Comments
|
07 Dec 09, 04:13 |
dow
What is your forecast after the DOW has reached your target 9,950 to 9,900 ? |


