Crude Oil Going To $80 a Barrel?
Commodities / Crude Oil Jul 16, 2007 - 04:17 PM GMTBy: Hans_Wagner
How do you beat the market when oil keeps on rising? Last week's rise in the price of oil to $74/barrel once again raises speculation that we could see all time highs in oil. As you might realize there are three factors that contribute the price of oil. Supply of oil, demand for oil and speculation. Looking at these factors may help provide a better understand of where the price of oil might go.
Supply of Oil
The following is from the Energy Information Administration Short Term Energy Outlook .
Non-OPEC Supply . Non-OPEC production is projected to grow by about 600,000 bbl/d in 2007 and by 900,000 bbl/d in 2008, roughly half the expected growth in consumption ( International Oil Supply Charts ). EIA's 2007 projections for non-OPEC supply have been lowered by 150,000 bbl/d from last month's Outlook, reflecting expectations that some U.S. Gulf of Mexico production will be affected by hurricanes, and lower-than-expected first quarter 2007 actual production data and continued project delays in Africa and Central and South America.
OPEC Supply. From the fourth quarter of 2006 to the first quarter of 2007, crude oil production by the OPEC 11 members (which excludes Angola) fell by 600,000 bbl/d, as OPEC attempted to reduce the buildup in global oil stocks. Preliminary second quarter data indicate that OPEC kept production fairly flat compared with the first quarter. The violence-induced loss of over 700,000 bbl/d of Nigerian crude production impacts global markets by reducing the availability of light sweet crude for producing gasoline. Angola, which is not subject to OPEC production quotas, is expected to increase production by over 300,000 bbl/d in 2007 and again in 2008. In upcoming months, rising oil demand is expected to outpace growth in non-OPEC supply, and EIA is assuming that OPEC 11 should increase production by over 1 million bbl/d to maintain normal inventory levels. If OPEC production does not increase and inventory levels decline, upward price pressures could result.
Inventories . The combination of OPEC members' production cuts and rising consumption has been causing OECD commercial inventories to fall from their high historical levels of last fall. Preliminary OECD data indicate a draw of 800,000 bbl/d in the first quarter (compared with an average inventory draw of 300,000 bbl/d for that quarter over the past 5 years), pushing inventories down toward the middle of the normal range at the end of the first quarter.
EIA's supply and consumption estimates for the second quarter suggest OECD inventories on a days-of-supply basis will continue to decline to the low end of the 5-year average range ( Days of Supply of OECD Commercial Oil Stocks ). If OPEC does not increase production, inventory levels could fall below the 5-year average, with the attendant price effects.
Nothing new here. Just that OPEC still is the swing provider for oil and they seem to be constraining the supply to help maintain higher prices.
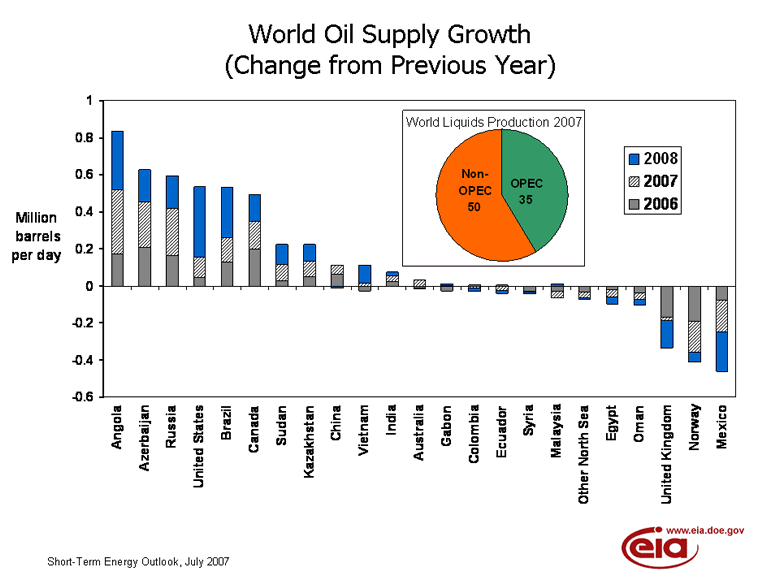
The chart below shows the change from the prior year in the supply of oil by country for the selected countries. What is interesting is the fall off in Mexico, Norway and the United Kingdom and the growth from Angola, Azerbaijan, and Brazil.

Saudi Arabia, the world's top exporter, had to cut production from 9.5Mbpd level of the past 2 years down to 9.1Mbpd (-400,000 barrels per day) since April-06, because it can find no buyers for it, The Wall Street Journal quoted Oil Minister Ali Al Naimi as saying on 5-Jun-2006.
The supply of oil keeps growing and new reserves are being found throughout the world driven by the high price of oil. With the very large reserves available in Saudi Arabia acting as the swing supplier, we can expect oil to remain a major source of energy for a long time.
Demand for Oil
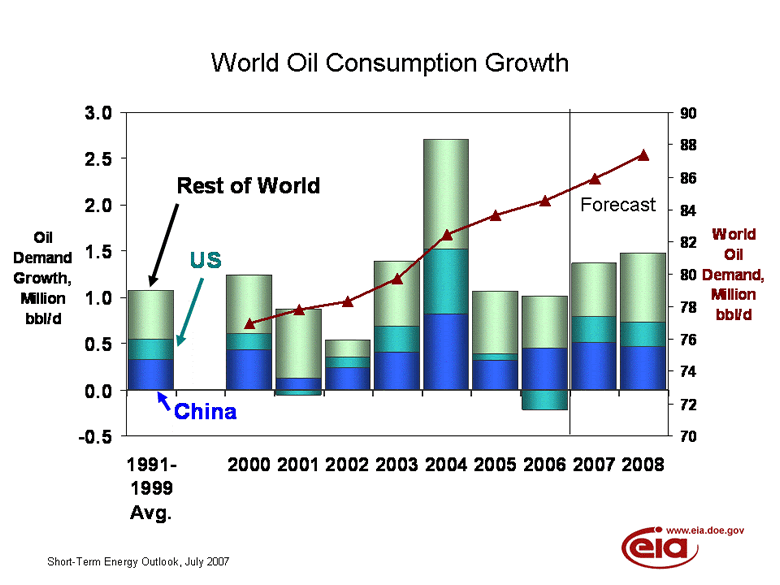
The following chart is from the EIA showing their expectation for world oil consumption growth. I could not find any explanation for the aberrations in 2001, 2002, and 2006. What is interesting is the upward rising forecast in the growth of demand for oil, represented by the dark red line. The growing global economy is driving up the demand for oil. This is especially true for China, India, and the rest of the world.
From everything I found the demand for oil will continue to grow with the price being the key balancing factor between available supply and demand. The developing middle classes in the rest of the world, especially China and India will drive the demand for oil.
Speculation
Traders in oil futures trade on the fear of the lack of supply and a surfeit of capital looking to profit from that fear. Commodity futures speculation has a property that other kids of speculation perhaps do not, or at least it has it in greater measure. That property is the extent to which it is tied to future physical events: actual projections of oil supply rates, which determine, really, whether the speculator is going to win or lose money, particularly on the longer-term contracts.
While total consumption has increased, the western economies are less reliant on oil than they were twenty-five years ago. This is due to substantial growth in productivity and the growth of sectors of the economy with little oil dependence such as finance and banking, retail, etc. The decline of heavy industry and manufacturing in most developed countries has reduced the amount of oil per unit GDP; however, since these items are imported anyway, there is less change in the oil dependence of industrialized countries than the direct consumption statistics indicate.
In the United States, for instance, each $1000 dollars in GDP required 2.4 barrels of oil in 1973 when adjusted for inflation this number had fallen to 1.15 by 2001. For calendar 1981, United States oil consumption was 5,861 million bbl and GDP was $5,291.7 billion, a ratio of $902.86/bbl. In 2005, consumption was 7,539 million bbl and GDP was $11048.6 billion, a ratio of $1465.45/bbl.
Traders in oil express the reason for price increases was perceived fears of supply disruptions. However, despite those fears in the recent past, the physical market remained very well supplied with sufficient inventories to meet demand. Perhaps this speculation is helping to encourge the supply-demand balance, as many economists believe.
The Bottom Line
I expect the price of oil to continue to move higher as global demand continues to be felt. Eventually we should see $80 oil. For an excellent book on how to predict macro moves of the market see Ahead of the Curve: A Commonsense Guide to Forecasting Business and Market Cycles ![]() by Joe Ellis.
by Joe Ellis.
Sources: Oil Price Increases 2004 – 2006 , World Petroleum Consumption , Energy Consumption per Real Dollar of GDP , Oxford Energy Comment .
By Hans Wagner
tradingonlinemarkets.com
My Name is Hans Wagner and as a long time investor, I was fortunate to retire at 55. I believe you can employ simple investment principles to find and evaluate companies before committing one's hard earned money. Recently, after my children and their friends graduated from college, I found my self helping them to learn about the stock market and investing in stocks. As a result I created a website that provides a growing set of information on many investing topics along with sample portfolios that consistently beat the market at http://www.tradingonlinemarkets.com/
Hans Wagner Archive |
© 2005-2022 http://www.MarketOracle.co.uk - The Market Oracle is a FREE Daily Financial Markets Analysis & Forecasting online publication.


