


Stock Market Sector-By-Sector Analysis
Stock-Markets / Sector Analysis Nov 30, 2009 - 10:12 AM GMTBy: Graham_Summers

 Yesterday, I noted that this market rally since March 2009 has been one of the most beta-heavy rallies in history. This means that picking out individual investments (individual stocks or companies) has contributed FAR less to investment success than the allocation of one’s money into the right “sector” or “asset.”
Put another way, looking for “winners” has been rendered virtually obsolete. After all, why bother with the due diligence required to perform successful stock picking when the ENTIRE S&P 500 is up 50%+ since the March lows? Just plunk your Dollars into the market index and you’ve got a serious gain.
I also noted in yesterday’s essay that much of this year’s market action has been fueled by the Dollar carry trade. With the Dollar showing more and more signs of a coming rally, I thought it would be worth reviewing the entire market on a sector by sector basis. If the market is indeed topping and preparing for a massive collapse, we should see the former leaders lagging the general index.
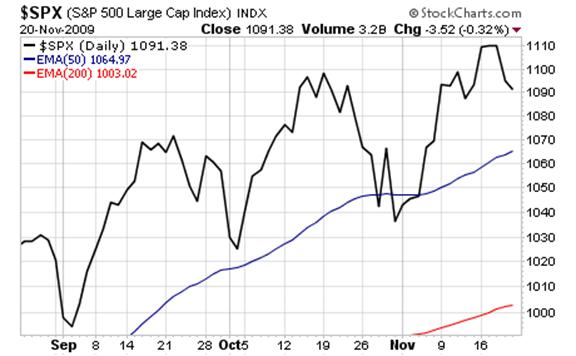
Let’s start with the S&P 500. Here we see the market breaking above its 50-day moving average and staying there since March 2009. More recently, since July the rally has been dominated by a new series of higher lows and higher highs.
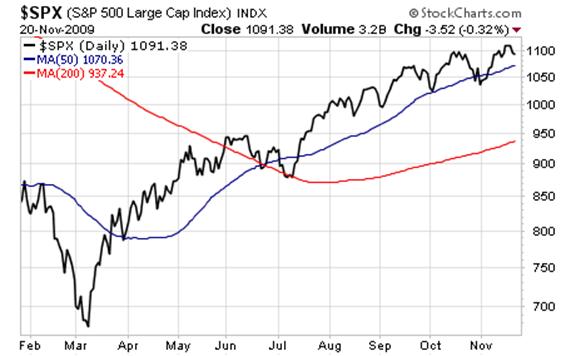
It is worth noting, however, that we saw a new lower low that broke below the 50day moving average in late October. This indicates the upward momentum may have been broken (combining more advanced technical analysis tools with macro trends, I think this is CERTAIN, but that’s a topic for another essay).
Ok, on to the sectors.
First off, Oil Services (OIH).
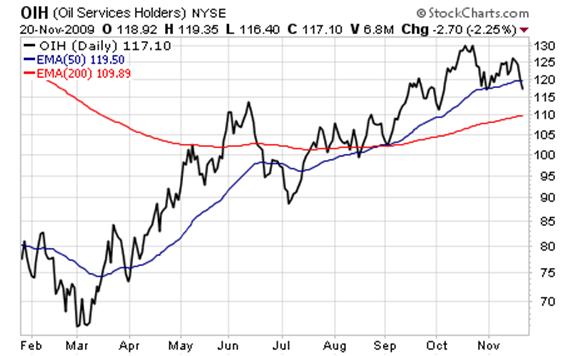
Unlike the S&P 500, oil service provider stocks have FAILED to make a new high. In fact, they’ve collapsed to test their 50-day moving average (DMA), bounced, and then broken the 50-DMA. The upward momentum here is decidedly broken and the next move should be a test of the 200-DMA.
So Oil is a lagger.
Ok, now for Pharmaceuticals (PPH):
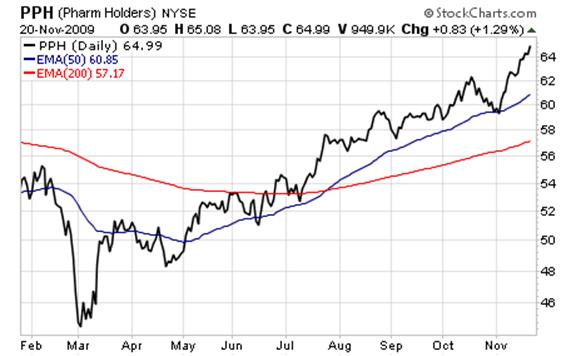
Wow, not only a new high, but a PARABOLIC one. The Pharmaceutical ETF is EXTREMELY overextended above its 50-DMA. The momentum here is strong, but has gone too far. Id expect a test of the 50-DMA or at least a small correction followed by a period of consolidation.
Pharmaceuticals are leaders.
Internet (HHH):
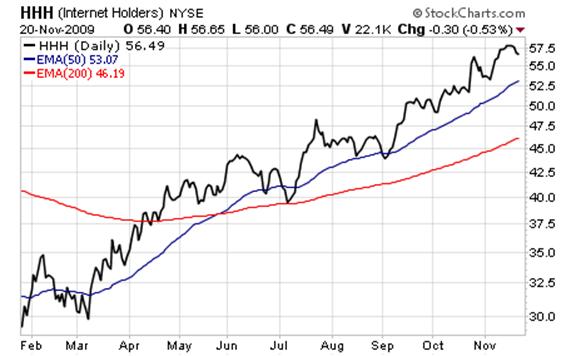
Very similar chart to the Pharmaceuticals: a new high and extreme overextension above the 50-DMA. Looks like time for a correction or at least a cooling here. But the uptrend remains strong.
Internet is a leader.
Semiconductors (PSI):
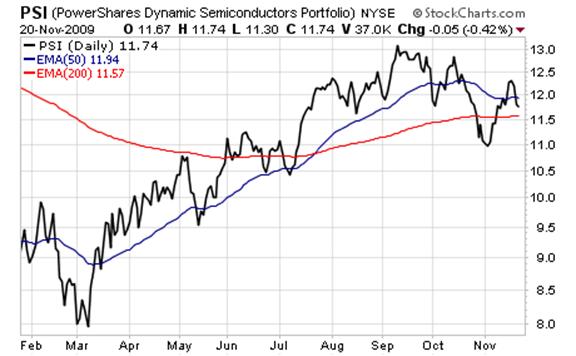
Another failed new high followed by a major breaking of support (50- and 200-DMA). This bounce has a “dead cat” look to it given that the semis broke through both moving averages with little difficulty.
Semiconductors are lagging.
Utilities (XLU)
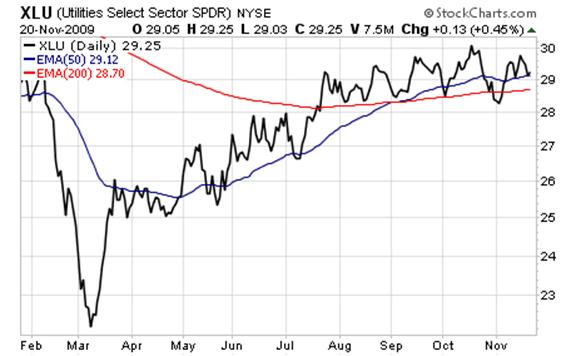
Wow. Possibly one of the weakest sectors in the market: utilities have essentially been trading sideways in an expanding wedge pattern since July. We also see a failure to hit a new high in November after the market plunge in October. Another laggard, and it’s closely related to the economy (as opposed to financials).
Defense (PPA)
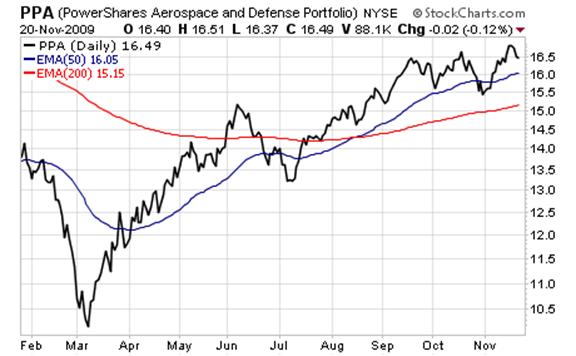
The upward momentum here is strong. We saw a brief violation of the 50-DMA but PPA quickly regained its composure and rebounded. We also see a new high in November. The momentum here shouldn’t bee too much of a surprise given the huge government spending going on.
Defense is a leader.
Nanotech (PXN)
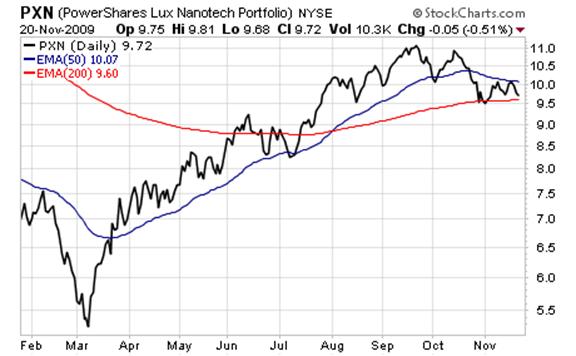
Upward momentum broken. Failure to make a new high. And now moving within a tightening trading range between the 50-DMA and 200-DMA. The potential for a violent breakout is high here. Looking at the chart I’d posit it’s going to be down.
PXN is a laggard.
Insurance (PIC)
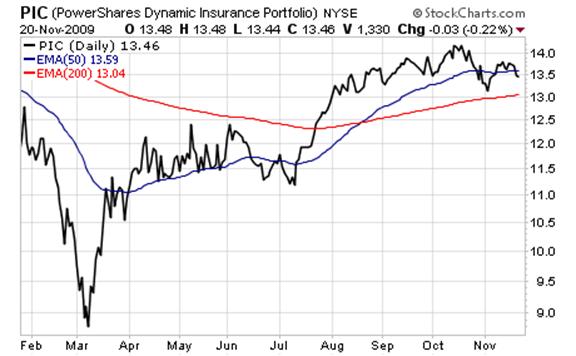
Another former leader now a laggard: insurance has failed to form a new high in November and looks to be rolling over after a dead-cat bounce. The next line of support is the 200-DMA. Below that and you’re looking at a drop to the July lows.
Insurance is a laggard.
We’re going to stop here for today. Here are the results so far:
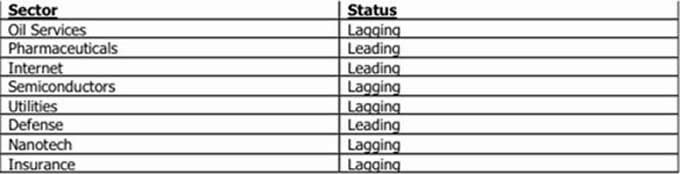
The bulls should take note that five of the eight sectors we’ve reviewed have FAILED to hit new highs in November. We’ve got another eight sectors to go tomorrow, but the mere fact we’re seeing so many sectors failing to confirm the general market’s new highs indicates that this latest rally into November is NOT the start of a new bull market (if it were we would be seeing market breadth INCREASE, not decrease).
I believe stocks are set to revisit the March 2009 lows sometime in the next twelve months. To that end, I’m already positioning readers for the coming storm with FREE Special Report detailing THREE investments that are set to explode when the next Crisis hits.
I call it Financial Crisis “Round Two” Survival Kit. Not only can these investments help protect your portfolio from the coming carnage.. they can ALSO show you enormous profits: they returned 12%, 42%, and 153% last time stocks collapsed.
Swing by www.gainspainscapital.com/roundtwo.html to pick up a FREE copy today!
Good Investing!
Graham Summers
Graham Summers: Graham is Senior Market Strategist at OmniSans Research. He is co-editor of Gain, Pains, and Capital, OmniSans Research’s FREE daily e-letter covering the equity, commodity, currency, and real estate markets.
Graham also writes Private Wealth Advisory, a monthly investment advisory focusing on the most lucrative investment opportunities the financial markets have to offer. Graham understands the big picture from both a macro-economic and capital in/outflow perspective. He translates his understanding into finding trends and undervalued investment opportunities months before the markets catch on: the Private Wealth Advisory portfolio has outperformed the S&P 500 three of the last five years, including a 7% return in 2008 vs. a 37% loss for the S&P 500.
Previously, Graham worked as a Senior Financial Analyst covering global markets for several investment firms in the Mid-Atlantic region. He’s lived and performed research in Europe, Asia, the Middle East, and the United States.
© 2009 Copyright Graham Summers - All Rights Reserved
Disclaimer: The above is a matter of opinion provided for general information purposes only and is not intended as investment advice. Information and analysis above are derived from sources and utilising methods believed to be reliable, but we cannot accept responsibility for any losses you may incur as a result of this analysis. Individuals should consult with their personal financial advisors.
Graham Summers Archive |
© 2005-2022 http://www.MarketOracle.co.uk - The Market Oracle is a FREE Daily Financial Markets Analysis & Forecasting online publication.