Overbought Gold Runs into Dubai Debt Crisis Turbulence
Commodities / Gold & Silver 2009 Nov 30, 2009 - 01:57 AM GMTBy: Clive_Maund
 Last week gold continued to rise to become super-extremely overbought as measured by short-term oscillators and then ran into heavy turbulence late in the week as the Dubai debt problems surfaced. The purpose of this update is to try to figure whether the action last week marks the start of a significant corrective phase.
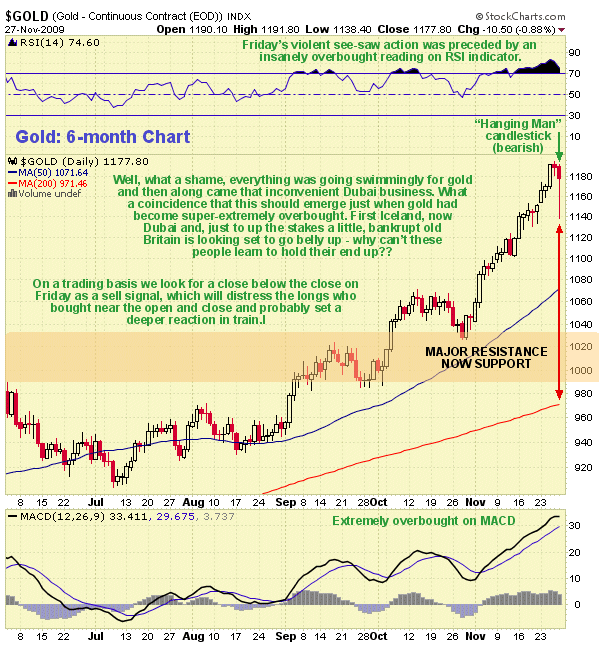
On the 6-month chart for gold we can see that gold had been rising with barely a pause throughout November so that it was already critically overbought on a short-term basis even before last week's trading got started, as shown by the RSI indicator at the top of the chart. Through most of last week it pushed even higher to become super extremely overbought by Wednesday - Thursday when a warning was posted on the site. The Dubai news broke about this time, perhaps not coincidentally on US Thanksgiving day, and gold plunged intraday on Friday, before recouping most of its losses by the close. So, what are we to make of this action?

In the first place gold was so overbought by the middle of last week that anything could have triggered a reaction, but it just so happened that it was the Dubai shock. Pundits are now actively playing down the significance of the Dubai problems, as we would expect, but this is a default on a much larger scale than Iceland, and could later be followed by a much bigger fish - Britain, whose finances are in a parlous state. We will not attempt here to extrapolate fundamental scenarios since that is beyond the scope of these updates. Instead we will confine ourselves to what the latest action in gold and the dollar portends - which is fair enough as the price is determined by the summation of all known and thus discounted fundamental information.
The wide swing in the price of gold on Friday and close towards the high left behind a "hanging man" candlestick on the chart. When one of these appears close to a new high after a big rise that has resulted in an extremely overbought condition, it is usually a sign of a reversal. Fundamentally the dynamics behind the creation of such a candlestick are as follows: the price plunges in the early trade due to some bad news, with nimble traders getting out as fast as they can. Those who have missed out on the rally and are chasing suddenly seize the chance to buy in at a better price, either unaware of the news, or unaware of its significance, and drive the price back up again later in the session.
What then most often happens is that the price drifts off again, perhaps days later, below the close of the "hanging man" with the buyers in between the open and close of the candlestick then becoming distinctly nervous and inclined to bail, the more so the deeper the decline, thus setting off a more prolonged reaction. Until that happens there is always a fair chance that the preceding advance will resume. Trades should therefore look for a close below the close of the "hanging man" as a sell signal. Other common sense technical indicators pointing to a reversal here are the MACD indicator shown at the bottom of the chart, which is now at an extreme level, and the very large gap between the price and its moving averages.

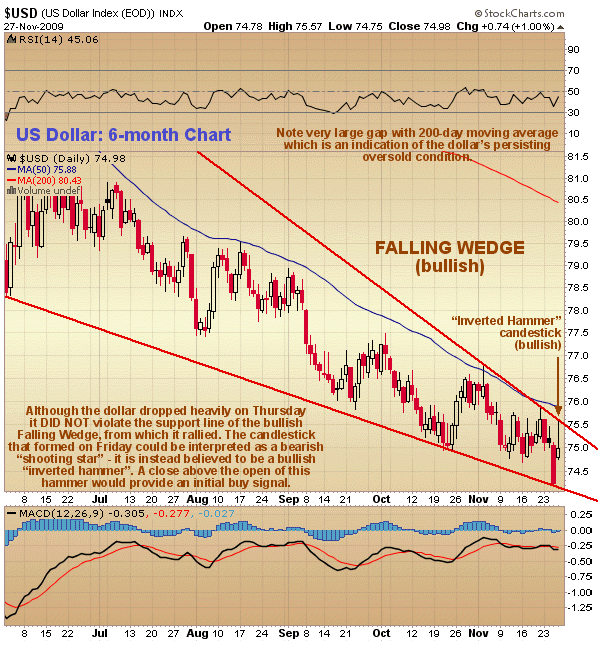
With the dollar being on the cusp of a BIG move after grinding slowly lower for months, the outlook for the dollar is of crucial importance to gold's fortunes, despite what some may say about "gold having broken free from the dollar" - it can never do that of course until the day it is not priced in dollars. A subscriber wrote in to advise me that the dollar had marked out a bearish "shooting star" candlestick on Friday, and that it was therefore set to decline. In the first place this interpretation is not congruent with a bearish "hanging man"having appeared on the gold chart, and secondly it is not a "shooting star" - it is instead a bullish "inverted hammer". The difference is that while both these candlesticks look the same, with an open and close near the day's low and a long upper shadow, a shooting star occurs around the end of an uptrend, while an inverted hammer appears around the end of a downtrend.
There are other potentially bullish factors to observe on the 6-month dollar index chart below, that include the strong convergence of the downtrend, which means it is a bullish Falling Wedge, and the current large gap between the dollar together with its 50-day moving average, and the 200-day moving average, a longway overhead. With the dollar index now pushing towards the apex of the Falling Wedge it is clear that breakout, one way or the other, is drawing near. From last week's action it looks like the breakout will be to the upside, and the time to commit to a trade is once the dollar closes above Friday's close. Going long at this point would probably enable one to pre-empt an upside breakout from the wedge, which would of course be expected to trigger a sizeable rally. With the dollar's terrible fundamentals it may seem like pure lunacy to talk about a possible big rally soon - but remember that`s what everyone thought before the huge rally last year, and while Dubai is unlikely to be the trigger, Britain is in a strong position to step forward and take this singular honor.

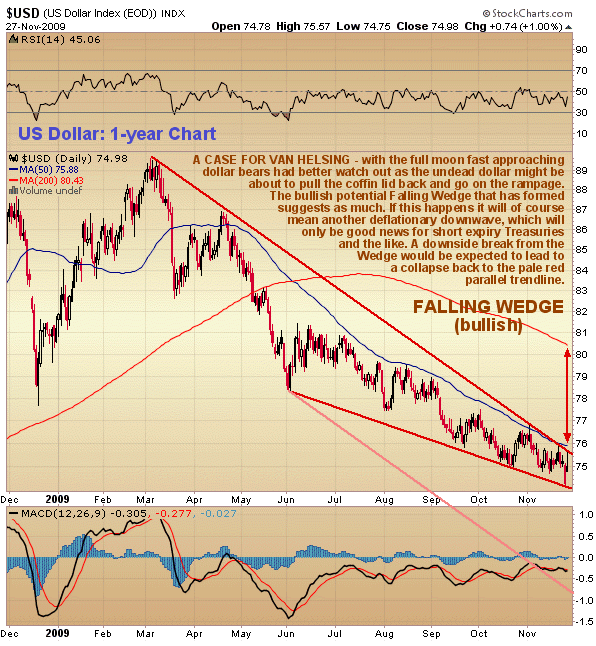
The 1-year chart for the dollar makes it even more clear that the dollar is on the cusp of a big move. While the Falling Wedge does suggest an upside breakout and strong rally, a downside break from the wedge would be expected to lead to an accelerated drop towards the pale red parallel trendline way below, which would be a disastrous development that would drive a near vertical spike in gold.
By Clive Maund
CliveMaund.com
For billing & subscription questions: subscriptions@clivemaund.com
© 2009 Clive Maund - The above represents the opinion and analysis of Mr. Maund, based on data available to him, at the time of writing. Mr. Maunds opinions are his own, and are not a recommendation or an offer to buy or sell securities. No responsibility can be accepted for losses that may result as a consequence of trading on the basis of this analysis.
Mr. Maund is an independent analyst who receives no compensation of any kind from any groups, individuals or corporations mentioned in his reports. As trading and investing in any financial markets may involve serious risk of loss, Mr. Maund recommends that you consult with a qualified investment advisor, one licensed by appropriate regulatory agencies in your legal jurisdiction and do your own due diligence and research when making any kind of a transaction with financial ramifications.
Clive Maund Archive |
© 2005-2022 http://www.MarketOracle.co.uk - The Market Oracle is a FREE Daily Financial Markets Analysis & Forecasting online publication.


