Natural Gas Screaming Long-term Inflation Mega-trend Buy, But UNG...
News_Letter / Natural Gas Nov 29, 2009 - 06:17 AM GMTBy: NewsLetter
 The Market Oracle Newsletter
November 22nd, 2009 Issue #88 Vol. 3
Natural Gas Screaming Long-term Inflation Mega-trend Buy, But UNG...Dear Reader This is the second in a series of analysis on the Inflationary Mega-trend that is anticipated to unfold over the next decade. The last article (Deflationists Are WRONG, Prepare for the INFLATION Mega-Trend) concluded that ever escalating debt fuelled stimulus coupled with never ending Quantitative Easing sows the seeds for a building inflationary outlook far beyond the deflationary impact of debt deleveraging as the DEFLATION of 2008 becomes increasingly old news which is evident in the reaction of near across the board asset and commodity prices during 2009 which WILL translate into higher consumer price inflation during 2010. Whist most commodities have soared during the year, however Natural Gas has been one of the few commodities lagging behind and therefore may present an opportunity to scale in at rock bottom prices for the Long-run as have mentioned several times during the divergence between Crude Oil and Natural Gas over the summer months. Do You Wish You Had Bought Crude Oil at $35 ? Stocks at Dow 6600 ? Gold at $700 ? Much as past great market opportunities, at the low no one wants to buy for a multitude of reasons. However taking a look at the long-term charts, you do not have to be a genius to arrive at the conclusion that Natural Gas is cheap, the only way a future Natural Gas spike to the upper ranges of many multiples of the current price is not possible is if Natural Gas suddenly became an redundant energy resource, which given that it is a far cleaner form of energy than other fossil fuels seems extremely improbable! Remember Natural gas is not a stock therefore its not going to go out of business to ZERO, nor is it likely to be displaced from the market place by new technology during the next decade at least. Natural Gas Fundamentals High prices bring on stream new supply, low prices bring about reduction in supply and investment, the longer Natural Gas trades at higher prices the greater will be the eventual new supply and subsequent crash in prices. The longer Natural gas trades at ultra low prices the less the forward supply investment and thus the greater will be the eventual spike higher in Natural Gas prices. What this suggests is the best type of price action for commodities is that of highly volatile highs and lows where sustained trends tend to resolve to extraordinary spikes in the opposite direction. The current Natural Gas price trend has been that of a sustained downtrend, which is primed to resolve to much higher prices to eventually more than the normal range. Off course this would also require Natural Gas position holders to ensure they are ready to distribute INTO such a spike else like many novice investors they may end up giving back most of the gains on the way down! Natural Gas is CLEAN ENERGY Natural gas is the dream fossil fuel of global warming proponents, as it is by far the cleanest of the three major fossil fuels of gas, oil and coal. Developed countries could cut their electricity generation green house gasses by at least 33%by making he switch to natural gas, whilst at the same time saving money. Natural Gas in Dollars
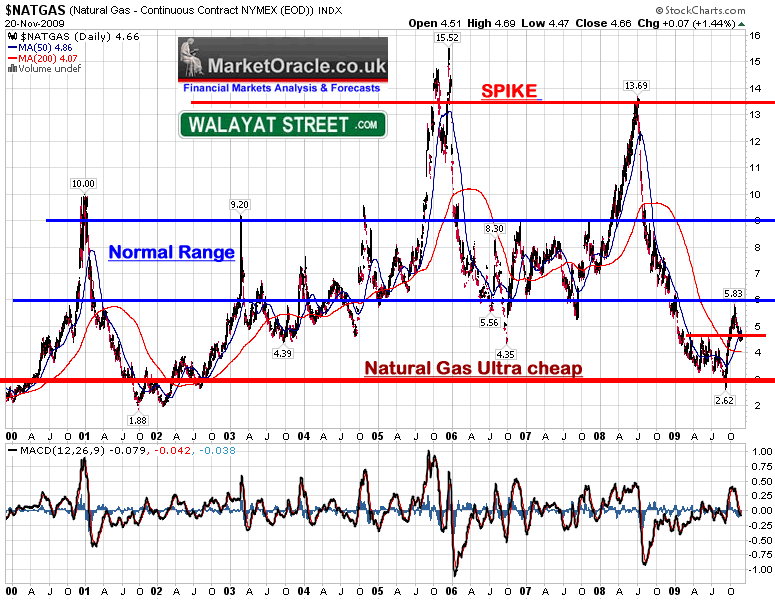
Natural Gas price range is typically between $9 and $6. Last close was at $4.66. Natural Gas is in short-term downtrend therefore suggesting lower immediate term natural gas prices. The price collapse form $13.7 to a low of $2.62 in September resulted in a powerful bounce to 5.83 that now brings Natural gas to its present day downtrend at a much shallower velocity than the preceding uptrend, Natural Gas. However Natural Gas HAS given a Buy Signal and therefore now targets a higher low (than the Sept low). Once the higher low is in then that will mark a strong stepping board for a sharp rally higher to significantly above the September peak taking Natural Gas into the Normal range, in the meantime my opinion is that of a great long-term accumulation opportunity with Natural Gas trading below the normal range. Natural Gas in Sterling
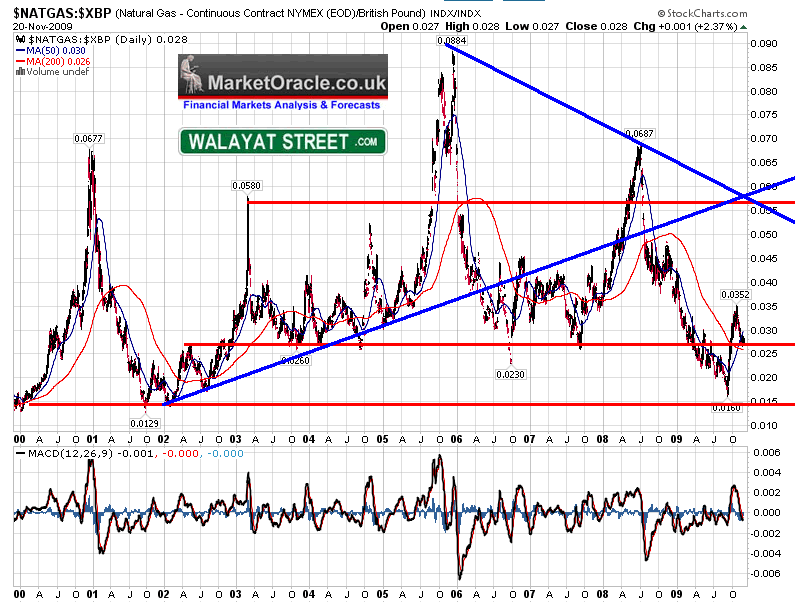
Sterling (GBP) Natural Gas is exhibiting a similar trend suggesting that sterling's trend is not an important factor given the magnitude of natural gas price movements i.e. the near doubling of price from 0.016 to 0.035 during September and the fallback now to 0.028. Natural Gas - Crude Oil Relationship
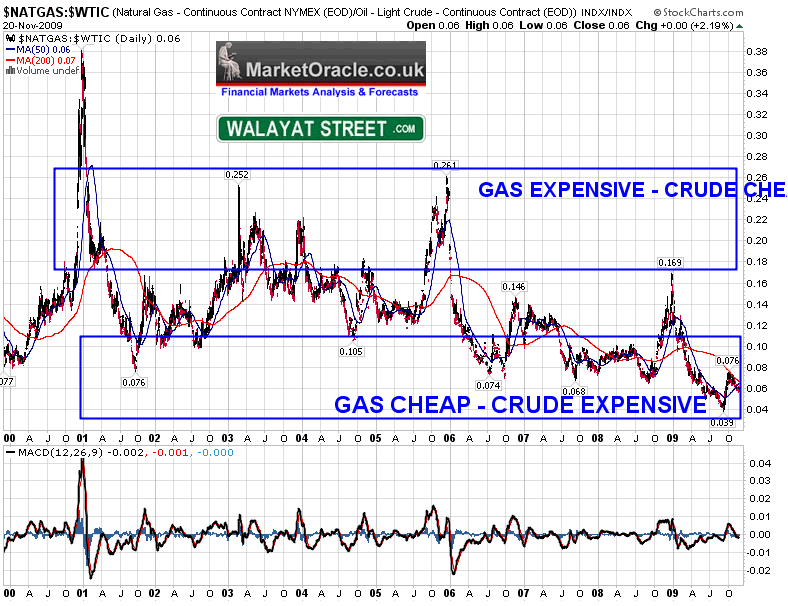
The Natural price collapse is most evident when compared against crude oil which saw the relationship drop to levels not seen in over 10 years, even after the recent September bounce the Natural Gas is still trading at near 10 year lows. Natural Gas has the potential to play catchup to Crude Oil in the order of 300%. I.e. even if Crude oil does rally any further, Natural Gas could triple in price. UNG ETF Performance Relative to the Natural Gas Price Now we come to the crunch point, having identified Natural Gas as being at an opportune level to accumulate into are the Natural Gas ETF's of which UNG is the most widely followed actually going to make us any money or not ? After all many an investor has dived blindly into ETF's on the suggestion of mainstream media hacks that rarely invest their own money on their commentaries to only find that they have lost money rather than made money which is especially true with regards Leveraged ETF's that should be ALWAYS AVOIDED AT ALL COSTS ! Back to UNG - The following charts UNG and the UNG / Natural GAS relationship.
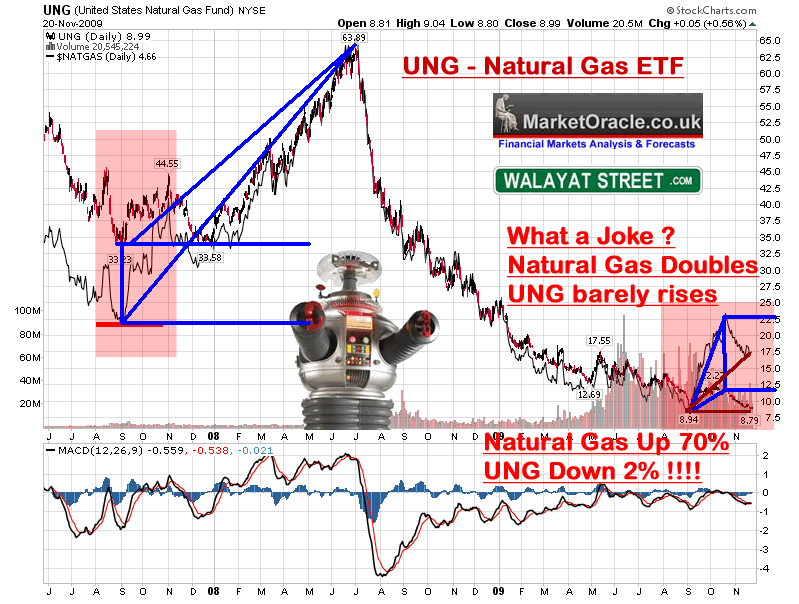
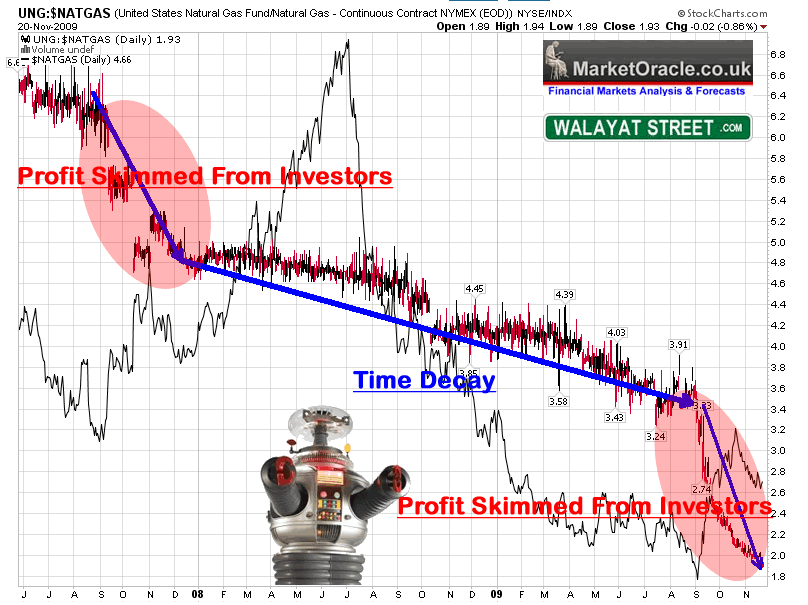
I have highlighted two areas that are suggestive of caution on the first chart. One in mid 2007 and second following the September spike. What we are witnessing is serious divergence between the Natural gas price and UNG, that is NOT subsequently resolved. Natural Gas gave a solid buy trigger in September, there was NO SUCH buy trigger on UNG, Natural Gas is making a significantly higher low, UNG is trading at fresh lows ! Those that bought Natural Gas Futures in early September would be sitting on a profit of 76%. Those that bought UNG are sitting on a LOSS! Is this like a SCAM or what ? Make your own minds up!
The second chart illustrates that there exists a perpetual tendency for the ETF to under perform the futures over time, which deploys a similar trick to the Leveraged ETF's in utilising % of daily movements. What this means is that UNG IS NOT A GOOD LONG-TERM INVESTMENT ! If you invest in UNG, you have to get your timing right, else TIME will erode the value of your investment even if Natural Gas DOUBLES in price! However on top of this we have PROFITS which are SKIMMED from investors as indicated by UNG that FAILS to rise when the Natural Gas price goes up! The UNG website states - The investment objective of UNG is for the changes in percentage terms of the units’ net asset value to reflect the changes in percentage terms of the price of natural gas delivered at the Henry Hub, Louisiana, as measured by the changes in the price of the futures contract on natural gas traded on the New York Mercantile Exchange that is the near month contract to expire, except when the near month contract is within two weeks of expiration, in which case it will be measured by the futures contract that is the next month contract to expire, less UNG's expenses. What a Load of B. S.! As always, the chart tells the REAL truth of what REALLY HAPPENS! Okay don't get all disheartened after having been built up towards a Natural Gas position. What this means is that you can expect between 40% and 70% of any Gain in the Natural Gas price to be skimmed off of ETF investors. Would Natural Gas rising to $13 result in UNG trading anywhere near 63.89 ? I doubt it. More likely Natural gas of $13 would equate to UNG price level of anywhere between 25 and 47. Though more probably in the region of 37 i.e. the expectation is to enjoy approx 50% of the gain in your ETF than that of Natural Gas futures. Therefore whilst investing in ETF's can yield a profit (of sorts), however unlike much of the hype surrounding them, they are NOT the one stop shop for investors, so there is no excuse for not doing your own home work in identifying individual stocks that could benefit hugely from a rise in the Natural Gas price, and again DO NOT EVEN THINK ABOUT Investing in LEVERAGED ETF's. INVESTING LESSON - Before you invest a single penny in any ETF, make sure you check its performance against the underlying market, better to find out the truth now then wake up one morning to find that you have not made any money whilst the underlying security soared in price! Unfortunately many and I truly mean many analysts FAIL to perform this exercise after having performed analysis of the underlying market then jump straight into recommend an ETF. I don't want excuses or explanations of why the expected return never materialised. I want an investment to do what it implies it is going to do rather than draw on small print to explain why investors have been hoodwinked into generating profits only for the fund managers! ETF's increasingly remind me of the Guaranteed Equity Bonds of 10 years ago that were designed only to make the issuers money and nothing for the investors But sold as sure thing big profit investments! Natural Gas Conclusion Yes you missed the September low, but the recent correction gives you another bite at the cherry AFTER the initial trend change buy trigger has already occurred. I.e. the risk of a loss is far lower now than accumulating before the September buy trigger occurred. Now I am NOT saying that Natural Gas is going to rocket higher in the coming days or weeks, but what i am saying is that it is not unreasonable to assume that Natural Gas will spike higher at some point during the next 1-2 years that would lift Natural Gas to at least $13 from the present $4.66. Especially as many commodities are busting OUT of their upper ranges which could conclude in an eventual spike significantly higher than $13. As for the UNG ETF? Khoick Phuhh. This is part of a New series on the INFLATIONARY outlook, ensure your subscribed to my always free newsletter to get access to full the scenario on completion as well as the many implications in your in box it will be one of my seminal pieces much as The Stocks Stealth Bull Market Scenario of March 09 and Crude Oil Top of July 08, or the UK Housing Market August 07 Top and Bear Market were before it amongst many others. Financial Market Forecasts Quick Update November 1st's in depth analysis (Stocks, Dollar and Gold Bull Markets Inter-market Analysis) gave updated projections for key markets into the end of 2009 and early 2010 as summarised below: Gold Targeting $1200 by March 2010, $1350 2010.: $1,150 ($1,046) + 10% Gold soared and silver played catchup. The target for March is $1200 the current price of $1,150 is well ahead of schedule, on face value this either signals some sort of impending currency crisis, or more probably Gold is short-term overbought and due a correction back through $1,100. Dow Targeting 10,350 to 10,500 During December 2009 :10,437 (9,712) + 7.5% target achieved. The Dow hit the mid target range of 10,425 and started a 'normal' correction that continues to target 9950 to 9900 (as per last weekends newsletter). USD Targeting 84 during December 2009 : 75.61 (76.36) - 1% The U.S. Dollar eeked out a small gain for the week as it continues to attempt to build a base at 75, with the nearest buy trigger remaining at 77.00. Source:http://www.marketoracle.co.uk/Article15238.html Your Natural Gas Investing Inflation Mega-trend Analyst. By Nadeem Walayat Copyright © 2005-09 Marketoracle.co.uk (Market Oracle Ltd). All rights reserved. Nadeem Walayat has over 20 years experience of trading derivatives, portfolio management and analysing the financial markets, including one of few who both anticipated and Beat the 1987 Crash. Nadeem's forward looking analysis specialises on the housing market and interest rates. Nadeem is the Editor of The Market Oracle, a FREE Daily Financial Markets Analysis & Forecasting online publication. We present in-depth analysis from over 400 experienced analysts on a range of views of the probable direction of the financial markets. Thus enabling our readers to arrive at an informed opinion on future market direction. http://www.marketoracle.co.uk Disclaimer: The above is a matter of opinion provided for general information purposes only and is not intended as investment advice. Information and analysis above are derived from sources and utilising methods believed to be reliable, but we cannot accept responsibility for any trading losses you may incur as a result of this analysis. Individuals should consult with their personal financial advisors before engaging in any trading activities.
You're receiving this Email because you've registered with our website. How to Subscribe Click here to register and get our FREE Newsletter To access the Newsletter archive this link Forward a Message to Someone [FORWARD] To update your preferences [PREFERENCES] How to Unsubscribe - [UNSUBSCRIBE]
|
||||||||||||||
© 2005-2022 http://www.MarketOracle.co.uk - The Market Oracle is a FREE Daily Financial Markets Analysis & Forecasting online publication.


