While Economic Pundits Play "Gotcha," the Unemployment Situation Improves
Economics / Economic Recovery Nov 26, 2009 - 02:52 AM GMTBy: Paul_L_Kasriel
 The best measure of the current condition of the labor market is the state unemployment insurance data. These data are not samples or surveys with guesstimates of how many new jobs were created by new businesses, but the head count of actual people standing in actual unemployment insurance lines. Too be sure, because a government entity is doing the counting, the first count is not always the most accurate count. But after four weeks of counting and recounting, the number that emerges is the one that remains for all times. The monthly labor reports from the Establishment and Household surveys get revised over and over, literally, for years.
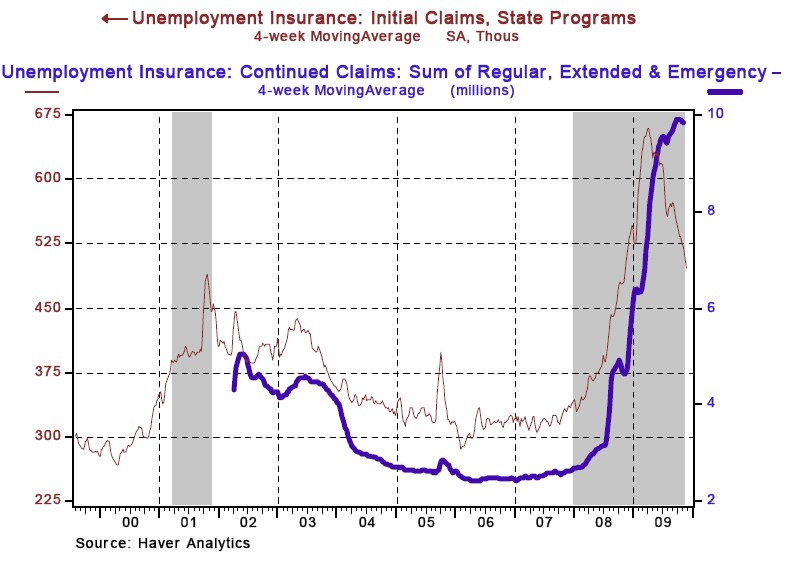
Weekly data, which the state unemployment insurance data are, are inherently "noisy." So, in order to more accurately measure the signal rather than the noise, it is prudent to average the state unemployment insurance data over rolling four-week periods. So, what are the state unemployment data signaling? They are indicating that the rate of firing has slowed significantly and that hiring could commence soon, if it already has not. As Chart 1 shows, the number of first-time claimants for state unemployment insurance on a four-week moving average basis has come down from a cycle peak of 659,000 in the four weeks ended April 4 to 497,000 in the four weeks ended November 21. Now, 497,000 new firings per week is nothing to brag about, but we can be thankful that it is coming down after the worst recession in the post-war era, a recession that started well before the stimulus program was instituted.
Although fewer people are now being fired, are any of those that have previously been fired being re-employed? Probably not yet, according to the continuing unemployment claims data, but the outlook for re-employment is improving. Because the past recession, which commenced in January 2008, well before the current stimulus program was initiated, was the longest recession in the post-war era, many of the people who have lost their jobs have been out of work so long that their regular unemployment insurance benefits expired. The current Congress and administration have implemented programs to extend unemployment insurance benefits to those who have exhausted their regular benefits.
If we add these extended benefit claimants, which are not seasonally adjusted and need not be because there is unlikely to be any regular seasonal pattern to them, to seasonally-adjusted benefit claimants under the regular program, we see in Chart 1 that the four-week average of combined continuing unemployment claims appears to have peaked at about 9.9 million people and in the four weeks ended November 7 had moved ever so slightly lower to 9.8 million. Again, nothing to brag about but something to be thankful for. The combination of a decline in the number of firings per week and a slight drop in the total number of unemployment insurance beneficiaries suggests either that hiring has commenced in a small way or that it is about to.
Chart 1

How much of the improving labor market conditions can be directly attributed to the current stimulus program is impossible to say. For the current administration to make any claims along these lines opens it up to legitimate criticism. But what is possible to say is that about three months after the stimulus program was initiated, the overall economy began to emerge from the deepest and longest recession in the post-war era and now, about nine months after the initiation of the stimulus program, the labor market is showing incontrovertible signs of improving.
Two of the biggest critics of the stimulus program with regard to job creation are two former chairs of the president's Council of Economic Advisers (CEA), Michael Boskin from the Bush Sr. administration and Eddie Lazear from the Bush Jr. administration. Both of these presidential advisers appear to have gained policy wisdom after leaving their presidential advisory posts. For you see, during both Bush presidential terms, Senior and Junior, and under the tutelage of Messrs. Boskin and Lazear, the U.S. experienced the slowest job growth in the post-war era. If these guys are so smart with regard to job creation, why was job creation so weak when they were advising presidents?
Thanksgiving Turkey? - George Melloan's WSJ Op-Ed
George Melloan is a former member of The Wall Street Journal's editorial page and it shows in his WSJ op-ed piece of November 24 entitled "Government Deficits and Private Growth." He starts with a political bias and believes that he has found the facts to support this bias. But there are other apolitical explanations of the facts. Melloan claims that commercial banks recent increased purchases of U.S. Treasury and Agency (Fannie and Freddie) securities is a direct result of federal government/Federal Reserve interference with the private sector. According to Melloan, federal bank regulators are encouraging banks to take less risk and are threatening to rein in executive salaries if banks take on more risk. And of course, all of this is to force banks to finance the mushrooming federal deficit.
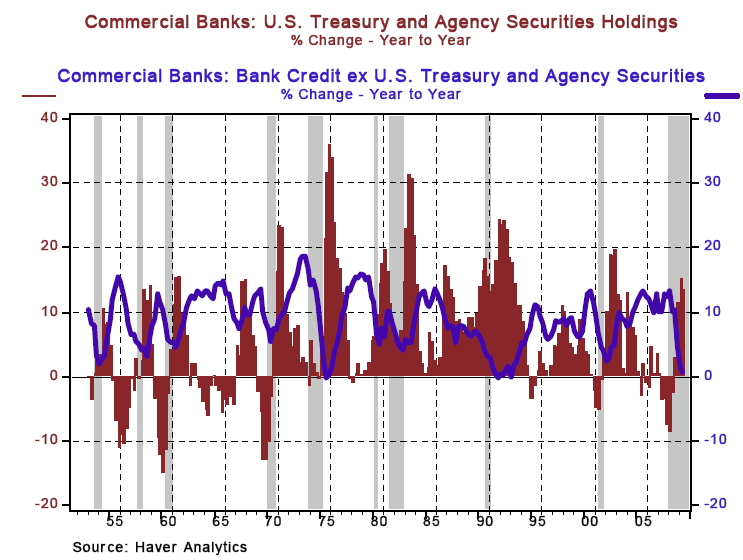
Let's review a little post-war economic history in Chart 2. The shaded areas in the chart are periods of economic recession. The red bars are the year-over-year percentage changes in commercial bank holdings of U.S. Treasury and Agency securities. The blue line is the year-over-year percentage changes in commercial bank holdings of loans and securities made to or issued by the private sector. Do you see any patterns here? Do you see that commercial bank holdings of Treasury and Agency securities typically shoot up during and right after recessions end - not just this one, but all post-war recessions?
In the first and second quarters of this year, the year-over-year increases in bank holdings of Treasury and Agency securities were 15.4% and 13.4%, respectively. These percentage increases are relatively muted compared to some previous cycles. For example, in each of the three quarters ended Q2:1992, the year-over-year increases in bank holdings of Treasury and Agency securities were about 24%. Also notice that the change in bank holdings of privately-issued debt tends to slow or contract in the latter quarters of recessions. And while the current slowdown in bank credit issued to the private sector is severe, the severity was greater after the 1973-75 and 1990-91 recessions. It appears, therefore, that there might be an alternative explanation for current bank portfolio behavior than Mr. Melloan's government interference hypothesis.
Chart 2

Is Mr. Melloan aware that banks need capital to expand their balance sheets, i.e., to create net new credit? Is Mr. Melloan aware that a loan to him or any other private sector entity incurs a charge against a bank's risk-based capital, capital in short supply these days because of losses from ill-advised bank loans to the private sector in the last expansion, but a loan to the U.S. Treasury does not incur such a charge? So, a bank's purchase of a Treasury security requires less capital than a bank's loan to Mr. Melloan. Is Mr. Melloan aware that there is another wave of losses generally expected to crash over the financial system in the not- too-distant future because of the excessive risk taking of some financial institutions in the past non-government interfered-with credit orgy? If and when this new wave of losses hits, the banking system will lose more capital? No, Mr. Melloan, current bank portfolio behavior is better explained by regular cyclical factors than your government-interference hypothesis. And by the way, Mr. Melloan, do you want the banking system to once again take on excessive risk that would likely result in another taxpayer bailout, which would push up the federal deficit that you so vociferously rail against?
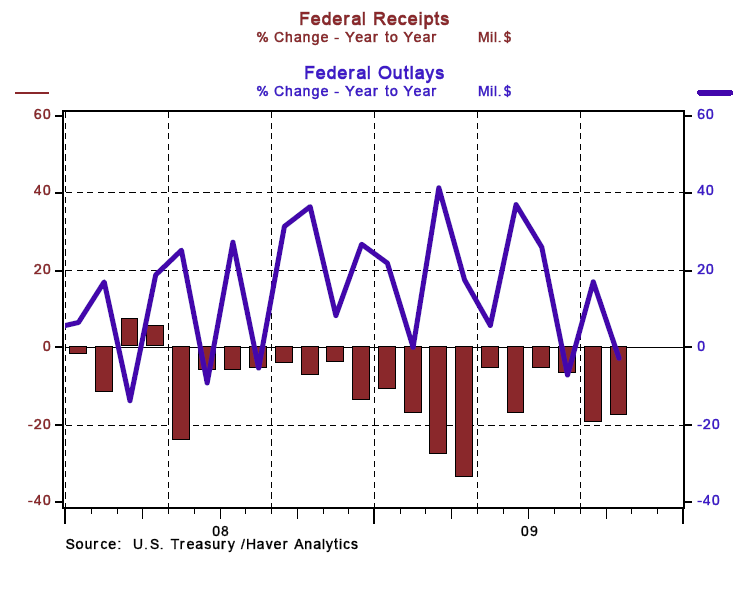
And, while we are on the subject of federal deficits, let's again look at some facts. In October, the year-over-year change in total federal outlays contracted 2.7% while total federal revenues contracted 17.9%. Likewise in August, total federal outlays contracted. So, in recent months, the federal deficit is being driven up primarily by declines in federal revenues, not increases in federal expenditures. Mr. Melloan, given your concern about the federal deficit and given that year-over-year changes in federal spending are contracting, can I surmise that you are in favor of increasing tax rates?
Chart 3

Paul Kasriel is the recipient of the 2006 Lawrence R. Klein Award for Blue Chip Forecasting Accuracy
By Paul L. Kasriel
The Northern Trust Company
Economic Research Department - Daily Global Commentary
Copyright © 2009 Paul Kasriel
Paul joined the economic research unit of The Northern Trust Company in 1986 as Vice President and Economist, being named Senior Vice President and Director of Economic Research in 2000. His economic and interest rate forecasts are used both internally and by clients. The accuracy of the Economic Research Department's forecasts has consistently been highly-ranked in the Blue Chip survey of about 50 forecasters over the years. To that point, Paul received the prestigious 2006 Lawrence R. Klein Award for having the most accurate economic forecast among the Blue Chip survey participants for the years 2002 through 2005.
The opinions expressed herein are those of the author and do not necessarily represent the views of The Northern Trust Company. The Northern Trust Company does not warrant the accuracy or completeness of information contained herein, such information is subject to change and is not intended to influence your investment decisions.
Paul L. Kasriel Archive |
© 2005-2022 http://www.MarketOracle.co.uk - The Market Oracle is a FREE Daily Financial Markets Analysis & Forecasting online publication.


