


Stock Market Update: Profit is the Only Real Portfolio Protection
Stock-Markets / Elliott Wave Theory Jul 14, 2007 - 01:26 PM GMTBy: Dominick
 Even the most casual market observers will have noticed Thursday's record-breaking explosion in stocks and Friday's new all-time highs in the S&P 500, but how many of them bought the bottom? And I don't mean piling into the momentum and squeezed out a profit. How many expected the move into the low and bought the gap down on Wednesday? My guess is that, even among all the professional traders and retail investors, the number who really did is very low.
And yet, that's exactly what members at TTC were able to do based on the information posted in our forums, in chat, and on the daily trend pages. For months members have known about our 1556 target for the S&P and, despite the mounting bearishness of the past month, the fear of a double top at the 2000 highs, and the appearance of cycles which were supposed to prevent a record-breaking run, our target has officially been reached!!!
But, as if all that wasn't enough, the market obliged us further by reversing off our target making our end of day short trade profitable with a surge downward through the bell and into 4:15 . This was nice, icing on the cake. The real story for today is how we got here.
The last several updates had expressed my skepticism in the move off the early July lows. For the most part we'd been using our unbiased framework to put together trades and make money on both the ups and downs of a range-bound market. Members were warned early this week, though, to be ready to break out of that range and to trade accordingly.
The big picture coming into the week was that we were either seeing a failed rally that signaled a market top was in, or that the drop was deceptive and would put in a bottom from which new highs could be reached. Last week's update flat out said, “I feel that we are at a point where we can get that blowoff/capitulation move, or buck the trend like we've been doing all along and finally this time take seriously the possibility of an important turn while most others stay bullish.”
As we know now, Thursday's rally was built on the back of the bears and casual buyers of “portfolio protection” who forced to cover and illustrate why profit is our preferred brand of protection. When Tuesday's opening gapped down, the two possibilities in the chart below became operative.
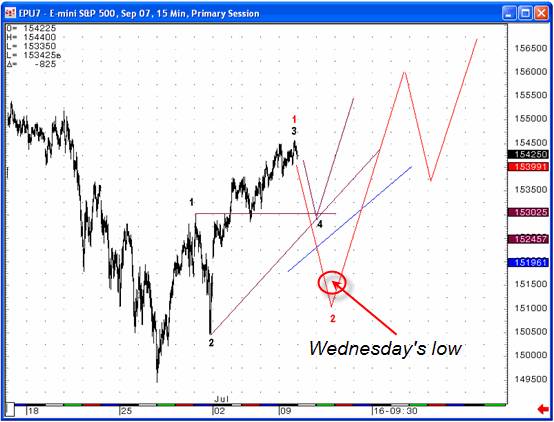
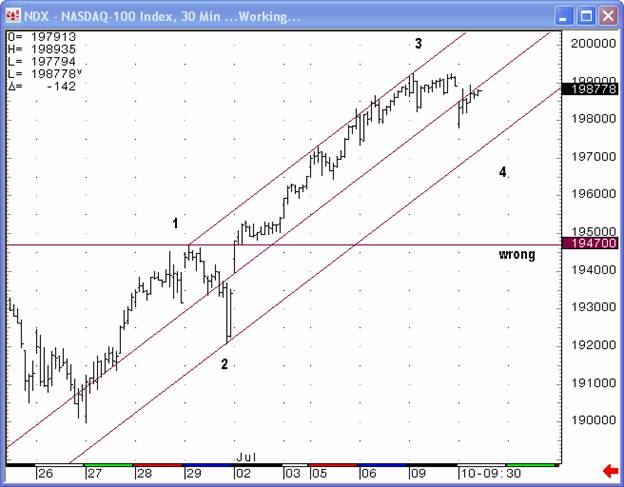
As you can see, having the red count allowed us to abandon the wave 4 idea but resist giving into a doomsday, market collapse scenario. We also had the Nasdaq, which needed lower for a fourth, and which we'd been watching as a market leader.
As of Tuesday night the only patterns we were watching was the larger wave 2 shown in the S&P above, or else the previous week's possibility of a failed 5th that signified a top being completed. Most would probably have expected me to take the failed 5th idea, claim victory and get short, but old members knew I wouldn't give in so easily. My 2 a.m. Wednesday morning post read:
I think that the w2 of the larger diagonal gets all the respect it deserves here. Of course I would be watching for any failure of that with an immediate plan if I saw it. Even if we have to switch ideas 15 points lower, it means nothing as we have been trading up into these highs and down from them as others worry about the "count." I am looking to see a 2nd wave of a larger diagonal find support here or a bit lower. Anything else is bearish but I'm not concerned of that yet.
The selling action on Tuesday and Wednesday fit very nicely with our expectations, but also proved the limitations of basing your trades on a weekly update. While weekend readers may have been selling Wednesday's open, or buying puts, members were urged to buy and get long what looked to be the start of a w3 of 3 up. The late day rally vindicated this outlook, but rather than fade the rally, the following 2 charts was posted as a roadmap for members:
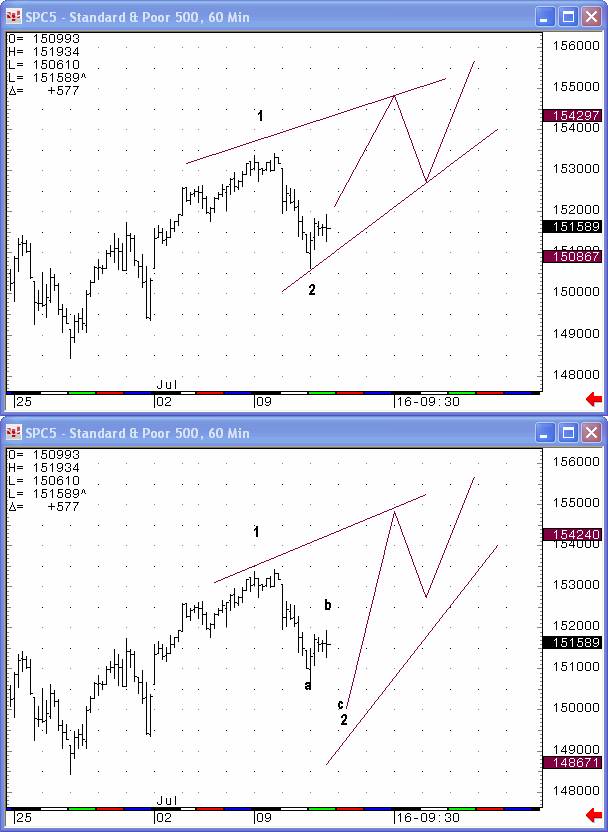
Once the market opened with a gap up, the path was clear to at least 1540. Members who bought the opening on Wednesday were exposed to over 30 points in 48 hours. Shorts at that point were tempting, but weren't working as we had a market that did not look like it wanted to quit until it reached our 1556 target. Of course now that the target has been reached, we're only now getting to the sweet spot!
The bottom line is that we just bought the low of a 50 point three-day rally and watched it already reverse slightly off its target on Friday. And, as usual, we feel we know where this market is going from here and when it's going to get there. This update offers hints, but the only way to really be able to take advantage of our hard work, to have 24 hour access, is to subscribe to TTC and become a member for the low cost of $89/month. Most experienced members easily pay the monthly fee with one trade, and for beginners there's a growing community of members ready and willing to ease your transition into profitable, unbiased trading. So, you could join now or wish you did later.
But don't just take my word for it. Here's an email I just received Thursday night after the big rally:
Just a quick note to compliment you on your call today and for the maps provided. Did not trade anything last week or even early this week until today. Reading the maps provided and the commentary it appeared to be a good day to go long. In the past I might have taken a few point gain but commentary in chat combined with the target set forth in the maps and the bc charts combined with rsi convinced me to ride this trade, until about 2:45pm
I could not have done this without the knowledge gained from this site. A great site providing market information and trading guidance that is truly unbiased.
Thanks again for the education and profitable experience.
Whether you're currently a trader or investor, this, more than ever, is the time to join a community that has correctly called the markets since its inception 18 months ago. For the monthly fee of $89, you have access to technical analysis of most financial markets and commodities, a live chatroom, proprietary trend charts and much more.
To make things a no lose situation, join before July 20, 2007 and if you don't like it after a full week's try, send me an email asking for a refund, No questions asked
Members
Be sure to visit the Weekly Maps. As many of you know, the Weekly Maps section of the site is where I lay out the big picture ideas for the following week along with charts from any other markets that seem to be playing a part in what we trade. And TRUST ME, the weeks ahead are important!
Also make sure you are aware of TTC's new addition to help many keep an eye on the Forum updates without needing to constantly login to check. We made this neat feature that you open to your desktop and you will be able to see when someone posts, and who is posting. There are some handy links there as well as a small time frame trend chart. I'm sure I'll find other things to add to it.
Have a profitable and safe week trading, and remember:
“Unbiased Elliott Wave works!”
By Dominick
For real-time analysis, become a member for only $50
If you've enjoyed this article, signup for Market Updates , our monthly newsletter, and, for more immediate analysis and market reaction, view my work and the charts exchanged between our seasoned traders in TradingtheCharts forum . Continued success has inspired expansion of the “open access to non subscribers” forums, and our Market Advisory members and I have agreed to post our work in these forums periodically. Explore services from Wall Street's best, including Jim Curry, Tim Ords, Glen Neely, Richard Rhodes, Andre Gratian, Bob Carver, Eric Hadik, Chartsedge, Elliott today, Stock Barometer, Harry Boxer, Mike Paulenoff and others. Try them all, subscribe to the ones that suit your style, and accelerate your trading profits! These forums are on the top of the homepage at Trading the Charts. Market analysts are always welcome to contribute to the Forum or newsletter. Email me @ Dominick@tradingthecharts.com if you have any interest.
This update is provided as general information and is not an investment recommendation. TTC accepts no liability whatsoever for any losses resulting from action taken based on the contents of its charts, commentaries, or price data. Securities and commodities markets involve inherent risk and not all positions are suitable for each individual. Check with your licensed financial advisor or broker prior to taking any action.
Dominick Archive |
© 2005-2022 http://www.MarketOracle.co.uk - The Market Oracle is a FREE Daily Financial Markets Analysis & Forecasting online publication.