Stock Market Trend a Tale of Three Cycles
Stock-Markets / Cycles Analysis Nov 24, 2009 - 02:57 AM GMTBy: Bob_Clark
 Has the market made a major low that will last for years, or are new lows in the cards, lets take a look.
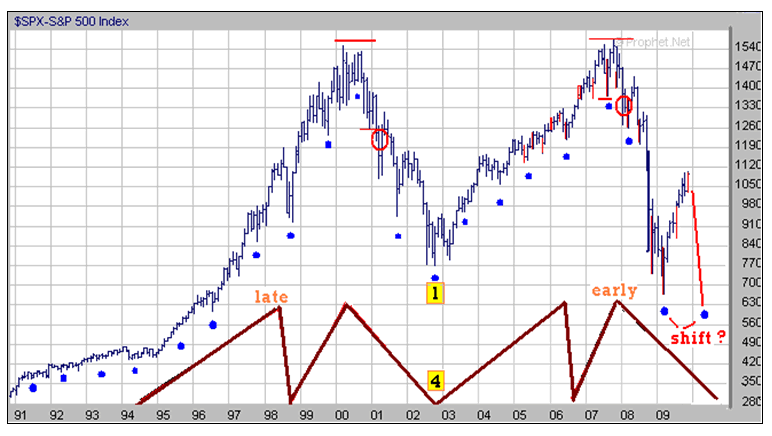
I use cycles as a road map, to do this I apply what I call my theory of relativity, it is based on the premise that there are multiple cycles in effect all the time and each cycle is subservient to the next larger cycle. For example in the chart below I have shown 3 key cycles, the largest being the well know 4 year cycle, the 1 year cycle, and a 4 month (red bars) cycle, there are many more cycles but for today's purposes these will do. Notice how during the past 20 years, the 1 year cycle (blue dots) has not gone below the previous 1 year low unless the dominant 4 year cycle has turned down, in fact on only 2 occasions, one being the drop into the 2002 low and again just recently (red circles), did we see a break of a previous 1 year low at all during the last twenty years!
Simple enough so far, easy money, but wait, there are flies in the ointment that make trading solely using cycles notoriously difficult, notice that the 4 year's cycle lows are often consistent, this is normally the case, but the highs are more erratic, this is called early, normal or late translation.
Also notice that there is often more than one low formed during each year each can be the year's low, it can come in early or late, leading one to question, where the heck are we. The thing that really has hair on it, is that a cycle can shift, some say it can skip entirely, but providing it acts like a low and rallies convincingly from it, I usually assume it did come in on schedule, but was of a smaller amplitude than normal, the lows in 1994 and 2006 are excellent examples of this.

Looking at the above chart we see the current dynamic, after making a double top, we went down, first breaking though a recent 4 month low and then surpassing all the lows of 2007. So we had broken the previous 1 year low, this showed that the 4 year cycle had turned down. Next we made a low in march of 08 which we can label as a one year low, also notice we made another low 4 months later, which at the time could also be labeled a 1 year low, in fact many analysts were calling for a bottom at that time.
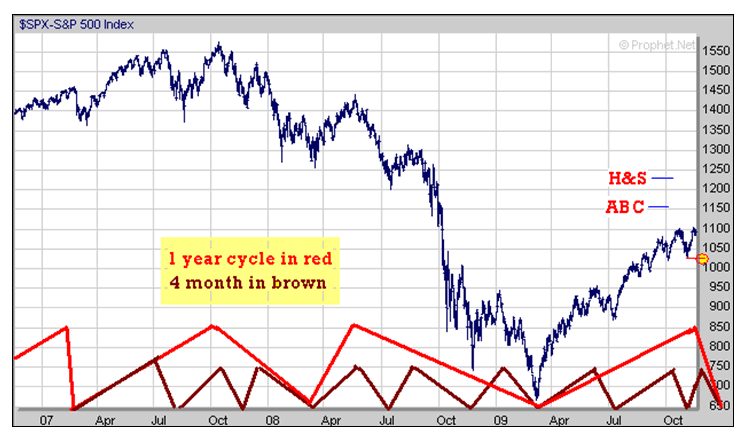
When that 4 month low was broken, the bottom fell out, we took out the 2002 low, then another 4 month low triggered a bounce, finally we made the low in march of 09, one year from the last low in march of 08, this happened when the 1 year low and the 4 month low both bottomed together (in cycle terms this is called nestling). Everything was fine up until then, a rally was expected from that point, the market was extremely over sold, we had all our ducks lined up and pow, the rally began right on schedule. As you can see from the chart we made an important 4 month cycle low in July, at that point many were seeing a head and shoulders top and expecting a new low, from there we rallied strongly to where we are today.
Darn, there is hair on it
OK that is all well and good, but what now? Here is what should happen, if everything goes like clockwork we should top out very soon and then drop sharply for the next 4 months, take out last year's low and make the next 4 year, 1 year and 4 month low in March.
However things have gotten a little fuzzy, the most obvious problem is that it almost seems impossible to fall that far, that fast, also we have gone up longer than the 1 year cycle should, you see, late in a 4 year down trend, the 1 year cycle should translate or turn early, not go up for eight or nine months (see late 2001-early 02), plus we just made what I believe is 4 month low and are still going up. As a trader, it has been my experience from watching shorter term cycles, that if a cycle shifts, it does it after a larger than normal move, which we have seen.

In the above chart I have shown the 4 month cycle, that has been so tradeable, I believe it just bottomed and is on its way back up, this is very clear on the Transports and the NASDAQ. I have also included potential targets, generated from the head and shoulders pattern and the measured move theory (ABC). Keep in mind that we can turn back down any time, giving an early translation.
A break below the last low would be lights out for this rally, in fact any weakness now will be a negative, after this break of the highs we should bolt up. The question is, when we do turn, can we go to a new low, anything is possible, there are a plethora of fundamental reasons for another panic, but one thing is clear, when this 4 month cycle tops, we could have 3 cycles pulling us back out of orbit, that is providing the 4 year cycle hasn't shifted. For now I continue to pick up nickles in front of the bulldozer, but I am wearing my running shoes.
To conclude, it is very possible that the huge price drop combined with the enormous reflation effort, will cause the 4 year cycle to come in early, more important is what I suggest you take from this article, which is how to use shorter term cycles to fine tune your investment timing and more important, protect your capital. Use the map to stay with the trend and never let a bigger cycle roll over on you again, remember it is all relative.
Next time I will look at the key cycles in gold.
Bob Clark is a professional trader with over twenty years experience, he also provides real time online trading instruction, publishes a daily email trading advisory and maintains a web blog at www.winningtradingtactics.blogspot.com his email is linesbot@gmail.com.
© 2009 Copyright Bob Clark - All Rights Reserved
Disclaimer: The above is a matter of opinion provided for general information purposes only and is not intended as investment advice. Information and analysis above are derived from sources and utilising methods believed to be reliable, but we cannot accept responsibility for any losses you may incur as a result of this analysis. Individuals should consult with their personal financial advisors.
© 2005-2022 http://www.MarketOracle.co.uk - The Market Oracle is a FREE Daily Financial Markets Analysis & Forecasting online publication.


