


Gold Danger as $1,100 Triggers 34% Drop in Demand
Commodities / Gold & Silver 2009 Nov 23, 2009 - 07:55 PM GMTBy: Ned_W_Schmidt

 Well, we may have a little deja vu all over again. What is the commonality between oil at $140 and Gold at more than $1,100? The answer is that demand for the oil was declining as oil approached $140, and the same is happening in Gold. From "Gold demand falls 34 per cent in 3rd quarter: World Gold Council," economictimes.indiatimes.com, 20 November, we read:
"Gold demand fell 34 per cent in the third quarter as high prices weighed on investment flows and led to a slump in jewellery buying in key markets like India and the Middle East, a World Gold Council report showed on Thursday." [Emphasis added.]
"But speculation in gold futures and expectations for more official sector bullion buying are keeping prices elevated despite a dearth of physical demand, according to the WGC's investment research manager Rozanna Wozniak."
"'For most of last year, the buying was very physical,' said Wozniak. '(Now), it seems to be more financial market-driven, by some of those other less visible instruments -- derivatives, futures, over-the-counter transactions."'
That physical demand is sparse and speculative demand is strong should serve as a warning of impending danger in the market for $Gold. Do high risk and danger mean automatically that $Gold's price should decline? No, it does not. However, the risk in $Gold is on par with risks that existed before the hedge fund induced mania in commodities last burst. Oil has not seen $147 since.
Per the statistical elves at Barron's, speculators in the U.S. alone are net long a little more than 280 thousand contracts for future delivery of Gold. Assuming all E-Mini contracts, those holdings would be the equivalent of about 280 metric tons. Assuming all full size Gold contracts, the equivalent is about 870 metric tons. Reality is obviously somewhere in between. Remember, all of those Gold contracts were bought on margin, a recurring source of credit bubbles.
That speculative demand far exceeds the real demand of buyers such as the Reserve Bank of India, another momentum buyer, should be acknowledged. A nice little speculative mania has been created in futures if ever one existed. Buyers beware should the chart patterns start to cause those traders to attempt to exit their position. To whom would they sell?
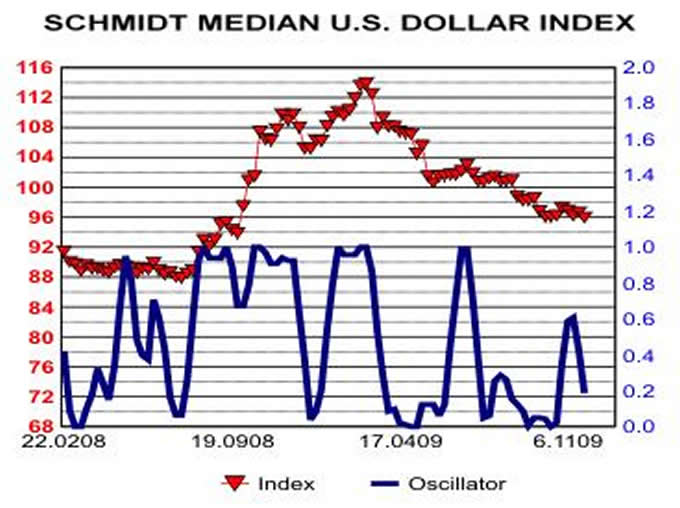
With less than six weeks till the end of the calendar year, the much predicted demise of the U.S. dollar seems to be running behind schedule. As our first chart this week, below, portrays, the value of the U.S. dollar has been moving laterally for some weeks. This index is a better measure of the trend of the U.S. dollar as it avoids the faulty weights in the popular dollar index.
The oscillator in that chart is again moving toward oversold. That situation, when combined with increasing frustration at central banks around the world over Federal Reserve's neglect of the dollar, suggests that the next path for the dollar may be a stronger one. The massive speculative bets being made on $Gold at this time would seem to require far greater dollar weakness than is likely. Buyers should be wary when speculative funds are making such large one-sided bets.
Our second chart, below, plots $Gold along with our overbought/oversold oscillator. The first important observation in that chart is the mini parabolic curve that has been fitted to the pricing experience of the past few months. These formations are always high risk, as they are usually resolved only in a painful fashion.
Second important observation is the extremely long period of time since the last over sold condition, or buy signal. That length of time is highlighted by the arrow. That oscillator has generated 26 over sold signals since the middle of 2002. The average length of time between those signals has been about 3 months. About 5 months has passed since the last over sold condition. Additionally, only 3 of those 26 signals were separated by a length of time in excess of 5 months. Could $Gold be on borrowed time in the short-term?
While a raging long-term $Gold bull with a current price target of US$1,724, this author must suggest that we remember that the long-term is comprised of multiple short-terms. The current situation with high speculative positions and Gold over bought in EVERY currency we follow may mean we are at one of those high risk short-term periods. Investors should perhaps be accumulating cash with which to aggressively buy Gold when the price break occurs.
Central banks, as they have clearly demonstrated over time, will indeed eventually take the wrong actions and make those Gold purchases profitable. Further, with the Obama Regime intent on destroying wealth for political gain, what better way to destroy the value of that wealth than through destruction of the purchasing power of the dollar on world markets. $Gold has a bright and shiny future as a consequence of the Obama Regime and Bernanke continuing at the Federal Reserve.
By Ned W Schmidt CFA, CEBS
Copyright © 2009 Ned W. Schmidt - All Rights Reserved
GOLD THOUGHTS come from Ned W. Schmidt,CFA,CEBS, publisher of The Value View Gold Report , monthly, and Trading Thoughts , weekly. To receive copies of recent reports, go to http://home.att.net/~nwschmidt/Order_Gold_GETVVGR.html
Ned W Schmidt Archive |
© 2005-2022 http://www.MarketOracle.co.uk - The Market Oracle is a FREE Daily Financial Markets Analysis & Forecasting online publication.