Stock Market Mixed Signals Warn of Near, But Not Imminent End to Bear Rally
Stock-Markets / Stocks Bear Market Nov 23, 2009 - 01:13 AM GMTBy: Andre_Gratian
 Current Position of the Market
SPX: Long-term trend - Down! The very-long-term cycles have taken over and if they make their lows when expected, the bear market which started in October 2007 should continue until 2014. This would imply that much lower prices lie ahead. As illustrated by the current market performance, this will not be a straight-down decline, but will consist of a series of intermediate-term rallies and declines until we have reached the low point.
SPX: Intermediate trend - The rally from the 1030 low has entered a consolidation/correction phase which is likely to be followed by higher prices into the normally bullish December season.
Analysis of the short-term trend is done on a daily basis with the help of hourly charts. It is an important adjunct to the analysis of daily and weekly charts which determines the course of longer market trends.
Daily market analysis of the short term trend is reserved for subscribers. If you would like to sign up for a FREE 4-week trial period of daily comments, please let me know at ajg@cybertrails.com .
Overview:
The one factor which probably has the most direct effect on the SPX right now is the price of the dollar relative to other world currencies. As a result of the Fed's low interest rate policy, the dollar has steadily depreciated in value. There is a 90% inverse correlation between the price of the dollar and that of the SPX, and the dollar carry trade is probably one of the reasons why we have had such an extended bear market rally since the March lows. It won't go on forever, and when the dollar begins to firm up -- which it may be ready to do -- that will spell the end of the rally.
John Mauldin's November 20 Frontline Weekly Newsletter discusses this subject. Here is a quote:
"...I agree that, overtime, the case for the dollar is not as good as I would like. But, in the meantime, we could have a very vicious dollar rally, which would take equity markets down worldwide, along with other risk assets. Why? Because it would be a major short squeeze."
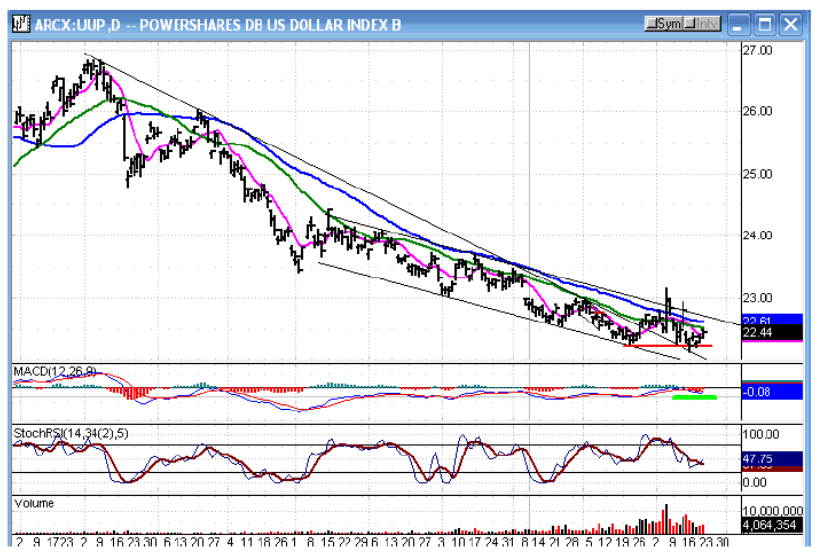
Below is a chart of the dollar ETF. There appears to be a lot of deceleration going on, especially when you look at the indicators which are sporting positive divergence. The price pattern also appears to be flattening.
The two recent spikes were due to some price re-adjustment in the ETF and not caused by dollar action. This may have been the reason for increased volume activity as well. However, the dollar chart shows the same pattern of deceleration and positive divergence in the indicators.
In spite of this, I think that the chart also indicates that some more work is needed before a reversal takes place, and this fits with the idea that the SPX could move up to about 1145 before completing its intermediate-term rally.
You might also notice that some de-coupling is going on between the Dow Industrials, which is currently the strongest index, and some other indices such as the Russell 2000, Financial index, and Value Line. This is not healthy.
There are other red flags, such as poor market breadth and low volume. But that does not mean that we are ready to collapse tomorrow ... just soon! You will see why as we discuss the indicators.
What's ahead?
Chart Pattern and Momentum
On the Weekly Chart, the most obvious obstacle to going higher is the long-term trend line which seems to have just repealed prices. You have to allow some leeway for trend line violations. On the daily chart, it has been violated, but if you convert the weekly chart to log-scale, you have not reached it yet. So the resistance is somewhere in this area, and would not necessarily stop us in our tracks as we hit it. If I remember my stock bible correctly, Edwards and McGee say you have to allow for 3 closes outside the trend line. But that may be for daily charts, only.
Besides the trend line resistance, the indicators are also showing negative divergence and the MACD has flattened out but has not crossed yet -- all warnings, not signals that we are done!
The wedge formation had become less and less meaningful, and I have converted it to a channel by drawing parallel lines to the top resistance lines. We will see the pattern more clearly on the daily chart.
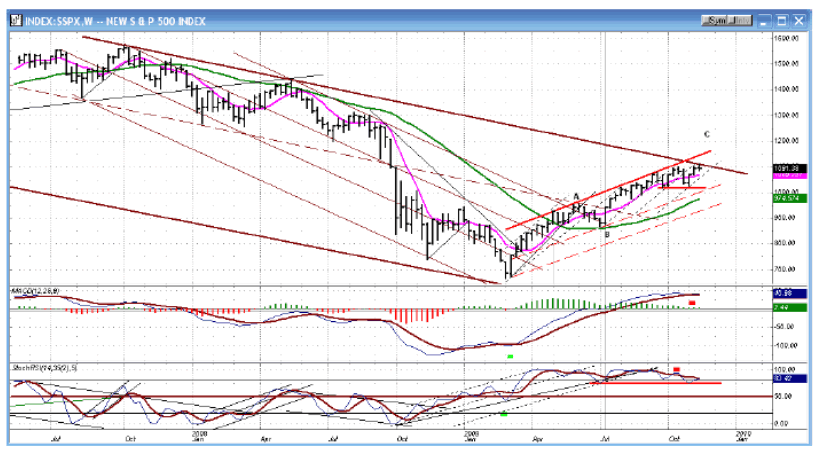
The Daily Chart of the SPX (below) shows 3 closes above the trend line. Hmmm! Well, after all, there are no absolutes and that is why it is said that technical analysis is art and not science.
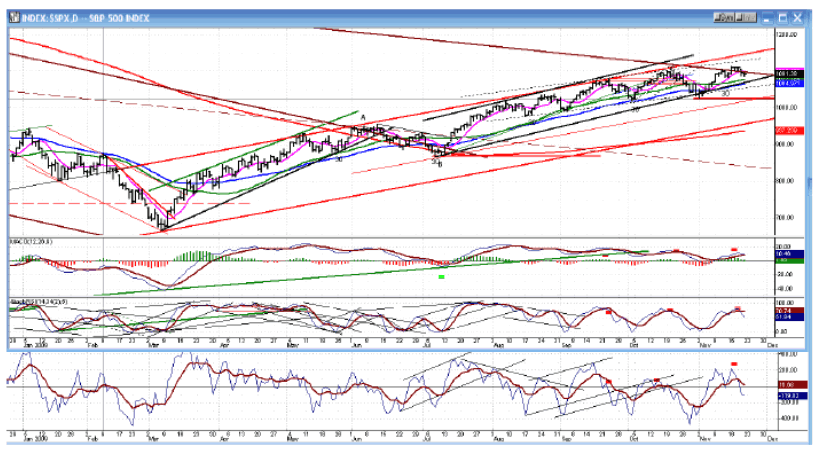
The red resistance line, at the top, is the extension of a former trend line. By drawing a parallel from the March low, we have a channel. Within that channel, we have two separate channels, and we are losing momentum both in the larger and in the second smaller channel as the price is no longer able to reach the top of either channel.
All indicators have turned down, but as we will see better on the hourly chart, the SPX has not yet broken below the 1085 level, which it would have to do in order to give a sell signal. It also remains well above the 50-DMA, which corresponds to the black channel lower support line. We won't have an intermediate sell signal until the SPX is trading at 1062 and lower, and confirmation will not come before the 1030 low has been broken.
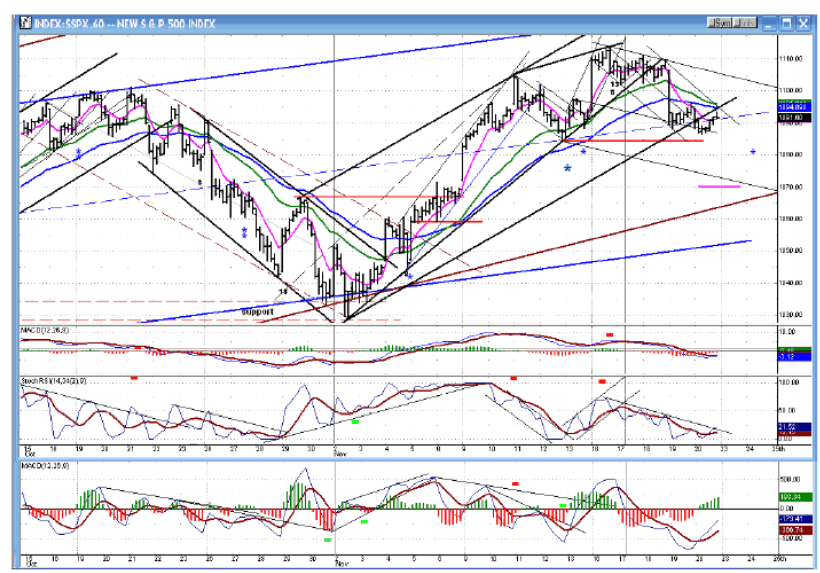
The Hourly Chart shows how the index briefly made a new high, but could not maintain it. It has pulled back to the previous support level which it is in no hurry to break, even though it has broken below the cluster of moving averages and the channel line, which was back-tested on Friday.
The red line is drawn at 1085. This is the level which must be broken for a confirmed sell signal (lower low), and if it is, we can expect the decline to continue to about 1070 (pink line).
The current price activity is going on within two larger channels whose lower lines (brown and blue) should provide some support if prices get that low. However, since the A/D indicator has already turned up, and the momentum index is trying to do the same after being oversold, there is a slight chance that the SPX could get back inside its channel and above the moving averages. We are in a bullish seasonal period and the shortterm sentiment indicator is mildly bullish.
Cycles
There are no cycles of significance directly ahead. A small cycle is due to make its low on Tuesday and another later in the week. It is still logical to assume that we are at the peak of the current 4-yr cycle and ready to roll over into next year.
Projections:
Reference to a 9-mo cycle low in the last newsletter was an error.
The current rally had a short-term projection of 1115, and longer-term to 1145 if the former top was decisively exceeded. The SPX came just short of its short-term projection by reaching 1113.69, but could go no higher and pulled back to a support level. If it is broken, the initial downside projection will be 1070.
Should the rally extend beyond its recent high, the 1145 target is still valid.
Breadth
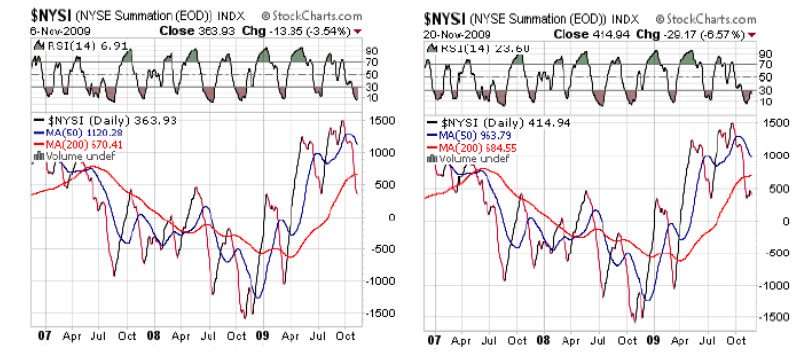
As you can see, there has been little change in the NYSE Summation index (courtesy of StockCharts) in the past two weeks. The fact that it is still oversold suggests that we may be more likely to have a rally than to decline further, and it may help the SPX hold the 1085 level.
Market Leaders and Sentiment
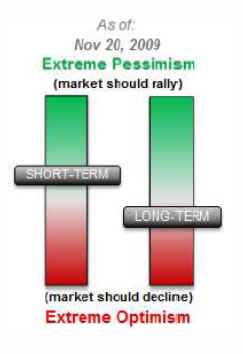
The sentiment indicator (courtesy of SentimenTrader) shows that the long-term index has deteriorated to just below neutral -- not enough to call for a major top.
On the other hand, the short-term index has become slightly bullish, which also could help the SPX hold above the 1085 level in its present consolidation/correction.
Longer-term still, the relative weakness of the financial index, Value Line, and Russell 2000 which refuse to follow the DJIA to new highs is definitely a red flag.
Summary
Mixed signals continue to warn us of a near, but not imminent end to the March 2009 rally.
The following are examples of unsolicited subscriber comments:
Awesome calls on the market lately. Thank you. D M
Your daily updates have taken my trading to the next level. D
… your service has been invaluable! It's like having a good technical analyst helping me in my trading. SH
I appreciate your spot on work more than you know! M
But don't take their word for it! Find out for yourself with a FREE 4-week trial. Send an email to ajg@cybertrails.com .
By Andre Gratian
MarketTurningPoints.com
A market advisory service should be evaluated on the basis of its forecasting accuracy and cost. At $25.00 per month, this service is probably the best all-around value. Two areas of analysis that are unmatched anywhere else -- cycles (from 2.5-wk to 18-years and longer) and accurate, coordinated Point & Figure and Fibonacci projections -- are combined with other methodologies to bring you weekly reports and frequent daily updates.
“By the Law of Periodical Repetition, everything which has happened once must happen again, and again, and again -- and not capriciously, but at regular periods, and each thing in its own period, not another’s, and each obeying its own law … The same Nature which delights in periodical repetition in the sky is the Nature which orders the affairs of the earth. Let us not underrate the value of that hint.” -- Mark Twain
You may also want to visit the Market Turning Points website to familiarize yourself with my philosophy and strategy.www.marketurningpoints.com
Disclaimer - The above comments about the financial markets are based purely on what I consider to be sound technical analysis principles uncompromised by fundamental considerations. They represent my own opinion and are not meant to be construed as trading or investment advice, but are offered as an analytical point of view which might be of interest to those who follow stock market cycles and technical analysis.
Andre Gratian Archive |
© 2005-2022 http://www.MarketOracle.co.uk - The Market Oracle is a FREE Daily Financial Markets Analysis & Forecasting online publication.


