


Stock Market Bearish Gravestone Doji Pattern, Dollar Spikes on Middle East Intrigue
Stock-Markets / Financial Markets 2009 Nov 23, 2009 - 12:55 AM GMT

 The The FDIC seems to be having a slow weekend! Keep checking on the FDIC Failed Bank List over the weekend. So far there is only one failed bank this weekend.
David Rosenberg points out that the world’s reserve currency is being used to fund just about every asset beyond cash on the risk spectrum.
The U.S. dollar has become a huge ‘carry trade’ vehicle for all risky assets. Historically, there is no correlation at all between the DXY index (the U.S. dollar index) and the S&P 500. In the past eight months, that correlation is 90%. Ditto for credit spreads — zero correlation from 1995 to 2008, but now it has surged to 90% since April. There was historically a 70% inverse correlation between the U.S. dollar and emerging markets, such as the Brazilian Bovespa, and that correlation has also increased to 90% since the spring. Even the VIX index, which historically has had no better than a 20% correlation with the U.S. dollar, has now sent that correlation surge to 90%. Amazing. The inverse correlations between the U.S. dollar and gold and the U.S. dollar and commodities were always strong, but these too have strengthened and now stand at over 90%. Is a reversal in the wind???
News from 1930.
Market wrap: “Powerful support” by “important interests” for high-grade shares gradually broadened into advances in “a long list of representative shares.” Market showed resistance to bad news for second day; yesterday to wheat news, and today to failure of an Exchange firm. Bear attempt to start reaction around noon fizzled. Major industrials, auto shares, and utilities showed sustained strength; rails, entertainment shares, and some industrial specialties were up sharply.
The VIX needs a breakout (week 2).
--The reversal pattern in the VIX is discernible in the weekly charts. It closed below Critical Support/Resistance at 22.72, but seems to be maintaining its strength in the downturns. The pullback into the broadening formation has expanded beyond the normal retracement, but should be considered bullish for the VIX as long as 20.10 is not taken out.
The SPX sports a weekly gravestone doji.
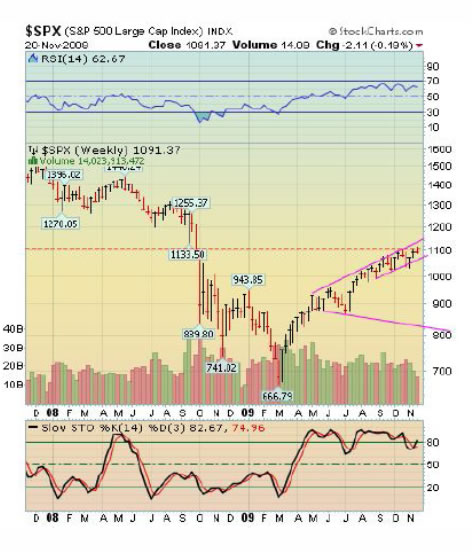
--The SPX shows a gravestone doji (a candlestick reversal pattern) for the week. It started strong on Monday, but could only drift lower for the rest of the week. Considering that the Cycle Pivot day was also on Monday, this is a good indication that a top may be in. We’ll need some follow-through early next week, which may arrive with a cycle low due before Thanksgiving Day. The monthly cycle pattern suggests at minimum a revisit to the 1029 low seen in early November. The Seasonal pattern offer s a minimum decline to or below 1000.
A gravestone doji in the NDX, too.
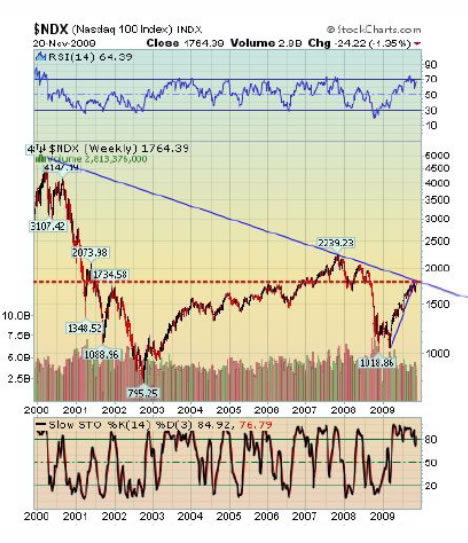
--The NDX sports a doji just below its 10-year old trendline from the peak of 2000. This is the first technical confirmation that the trendline has a good probability of holding. Many people assume that, since this is the last quarter of the year, the positive seasonal influences should take over and carry the market higher through the end of the year. The fact is, it does happen about 70% of the time, but given the rally since March, we’ll have to pull something like the 2003 experience over again, according to Sy Harding, the seasonal cycle expert. Let’s see what the pre-Thanksgiving correction does for the shopping crowd.
Gold appears to be complete.
-- The higher wave (B) in gold is indicative of a longer-term uptrend in gold. However, it appears that gold may have topped this week. The indications are that, if gold declines on Monday, there will be a daily reversal pattern intact in this precious metal, since Friday’s high did not exceed the spike high on Wednesday. Since this is a 5th wave of a series, the decline could be dramatic. The normal retracement range over the next two years could be from 550 to 700.
Oil may be ready to spike up.
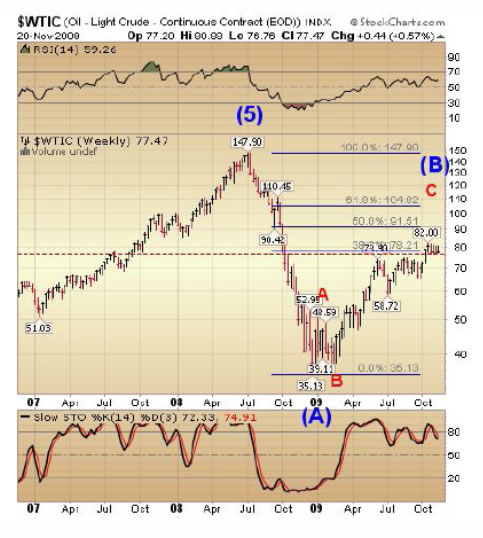
The month-long sideways consolidation (a continuation pattern) in $WTIC has me concerned that it may go higher before a reversal. I had been expecting oil to lead equities down, but it had a positive week, instead. I cannot imagine why oil would spike up, since we seem to have more than adequate supplies here in the U.S. and consumption is declining. The alternative is a potential outbreak in the Middle East that may affect the price of oil in the near term.
The Bank Index shows a weekly reversal pattern.
The $BKX remained below Critical Support at 43.96 this week and now shows a multi-week reversal pattern below its trendline (and a gravestone doji, too). All of these indicators make the case for a substantial decline straight ahead. My Model suggests a seasonal low at 32.50.
The Nikkei begins the plunge.
I don’t think that the Japanese were impressed with President Obama’s speech in Tokyo last week. But you could see that the Nikkei was losing its grip since August. I haven’t even started my cycle studies on the Nikkei, so I cannot judge how long its decline may go. However, unless there is a very steep decline in the next few weeks, it appears that the next opportunity for a cycle bottom could be in February 2010. Preliminary calculations put the next low at 8500 – 8600, but the confluence of the cycles could make it deeper.
$USB may have formed a right shoulder.
-- $USB made an unconfirmed rally this week to form what may be a right shoulder in the (red neckline) head and shoulders pattern. If $USB decides to proceed down, the minimum target is below the June low at 113.12 and possibly a break of its longer-term trendline. The pattern outlined in blue is a bear flag, which I had a hard time identifying in the daily chart. A break of the lower trendline also confirms the head and shoulders pattern.
The $USD cannot avoid intrigue.
--The fundamentals appear to point to a lower dollar in the near term. However, that does not count the political dimension, such as an outbreak in the Middle East. There is a lot of money in the Middle Eastern sovereign funds that would make a quick exit to the U.S. dollar if such an event were to occur. There was some crazy action in the ICE exchange early Friday morning. The dollar futures spiked 9% to as high as 82.18 (that’s right) around 7 am. This also caused the stock futures go drop lower in the premarket. All trades above 76.50 were cancelled by the exchange shortly after.
Our Investment Advisor Registration is on the Web
We are in the process of updating our website at www.thepracticalinvestor.com to have more information on our services. Log on and click on Advisor Registration to get more details.
If you are a client or wish to become one, please make an appointment to discuss our investment strategies by calling Connie or Tony at (517) 699-1554, ext 10 or 11. Or e-mail us at tpi@thepracticalinvestor.com .
Anthony M. Cherniawski,
President and CIO
http://www.thepracticalinvestor.com
As a State Registered Investment Advisor, The Practical Investor (TPI) manages private client investment portfolios using a proprietary investment strategy created by Chief Investment Officer Tony Cherniawski. Throughout 2000-01, when many investors felt the pain of double digit market losses, TPI successfully navigated the choppy investment waters, creating a profit for our private investment clients. With a focus on preserving assets and capitalizing on opportunities, TPI clients benefited greatly from the TPI strategies, allowing them to stay on track with their life goals
Disclaimer: The content in this article is written for educational and informational purposes only. There is no offer or recommendation to buy or sell any security and no information contained here should be interpreted or construed as investment advice. Do you own due diligence as the information in this article is the opinion of Anthony M. Cherniawski and subject to change without notice.
Anthony M. Cherniawski Archive |
© 2005-2022 http://www.MarketOracle.co.uk - The Market Oracle is a FREE Daily Financial Markets Analysis & Forecasting online publication.