Stock Market High Drama Week with No Material Gain or Loss
Stock-Markets / Stock Index Trading Nov 22, 2009 - 04:28 AM GMTBy: Piazzi
 Tight action and a negative bias ended another OpEx week.
Last week was a rather high drama week with no material price gain or loss.
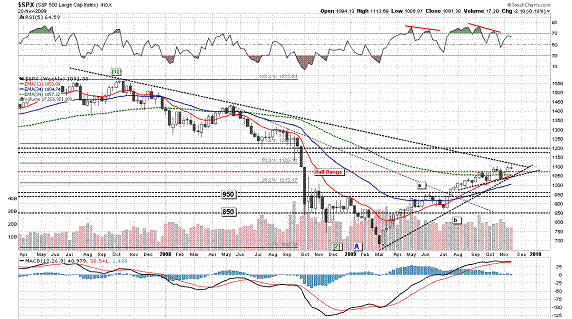
S&P tried a pass at the 2007 downtrend line but was rejected. The week was low in volume overall and ended flat. It can easily be viewed as a consolidation week. As long as the index stays above key support afforded to it by the flat 89 EMA and the rising shorter EMAs as well as key support lines on the chart, it will be in a technical consolidation and can work on relieving some excesses (aka overbought readings) and launch another assault at a breakout above the long term downtrend line of 2007.
Throughout the uptrend from March, bears have had many opportunities to prove themselves as players. But they have consistently failed at inflicting damage when and where it mattered.
The jury is still out on the bears ability this time around, but if they should how us something in the coming week or some of us who are waiting in the wings, and are yet to pick a side may give the benefit of the doubt, yet again, to the bulls.
A break above the downtrend line can easily send the index for a test of 1150 area.
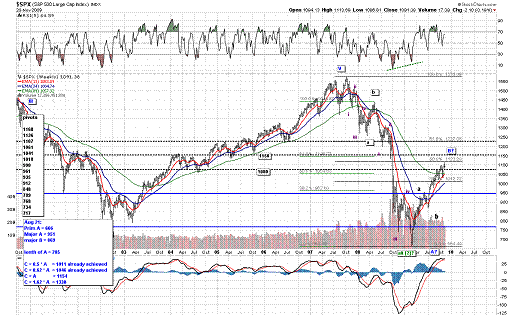
Many are talking of 1120 as a potential next target. It measures a 50% retracement of the drop from 2007 peak. It also roughly marks half of the range formed between 1080 (2004 low) and 1150 from 2005.
The uptrend is showing some significant negative divergences on weekly and daily frames
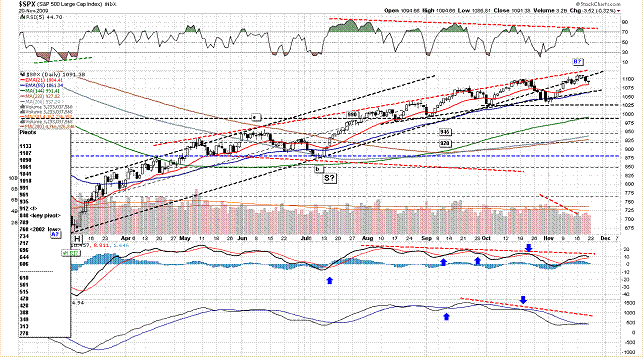
Still, price is the most important indicator of all, and as long price stays the course, divergences are just warning signs against brand new commitments, and in favor of securing/trimming/insuring existing commitments.
As can be seen from the chart above, the latest advance from October lows has been associated with below average volume. Volume expanded during as price came under pressure but still remained below average. This can be viewed as a lack of interest in new long position, and a reluctance to get out of existing positions.
It feels like people are just waiting, and that is the very essence of a consolidation period.
Daily chart has ample support from positively aligned moving averages and a succession of higher lows. It should not be difficult to set objective exit points for positions established from lower levels in case we see more severe signs of distribution and price decay.
This past week saw a bit of distribution
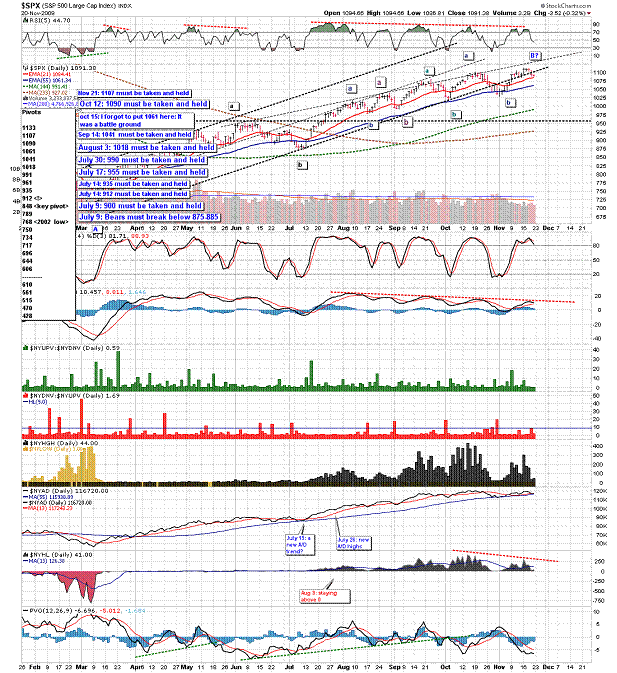
As price was coming out of the March low, one of the breadth measures that we were monitoring was Net New Highs, and it helped us part our ways with the bears. Recently, that measure has been negatively diverging from price.
Also, Advance/Decline line is yet to confirm the latest peak by making a new high.
There are many other breadth measures that show signs of deterioration
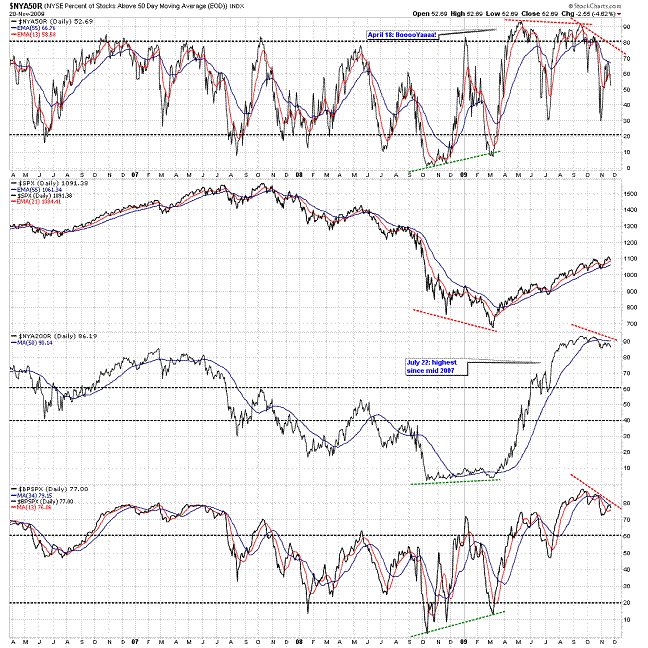
McClellan Oscillator and the Summation Index are also weak at this time
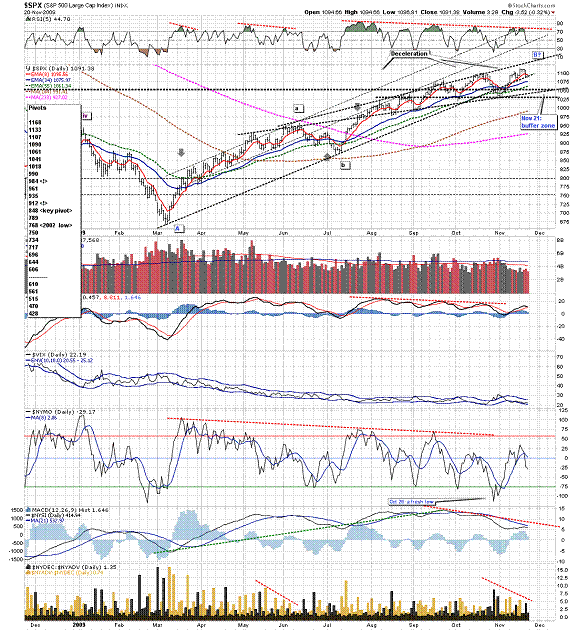
Notice from the chart above the deceleration nature of price peaks. On the other hand, there is a support band in the 1025-1050 range that looks very formidable at this time.
From an Elliott Wave point of view, it is very difficult to view the rally since March as a bullish, impulsive run.
The leg from March to June can be counted as an impulse, and I kept an alternate bullish count for the whole duration
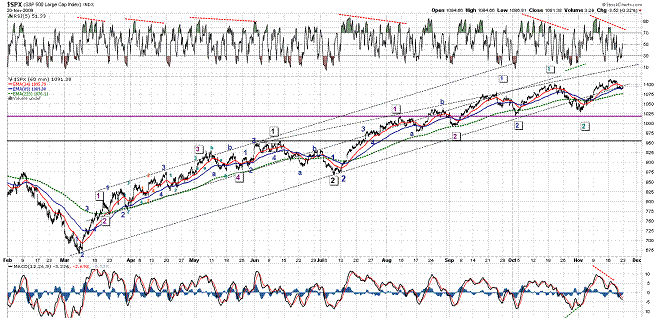
But since July, the up swings have overlapped each other. One can always say that, technically, we may have a series of 1-2-i-ii-1-2 waves, which is super bullish in nature. It is a bit hard to count it like that with high probability since we are having all sorts of momentum and breadth divergences right now.
I have not seen the above count anywhere. Every Elliott Wave count that I see is one way or another expecting either a 3 of 3 of 3 to the depth of hell, or a C wave to at least challenge the March low.
But, it is technically possible, and bears have time and time again showed us how ineffective they are. We also know that money is (or has so far been) cheap, if you can get it at source, that is.
If we are indeed having a bullish run like the chart above, we should soon see a breakout above the 2007 downtrend line, followed by noticeable surges in momentum and breadth.
A move below 1025 (which also is the lower edge of my support band discussed above) will more than likely put the bullish count to rest.
Even if we are in a corrective wave structure like this
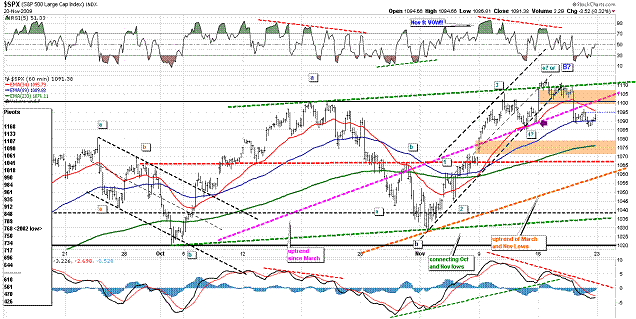
The sequence of ABCs can keep multiplying. Or, we some complex corrective structures may take shape.
Bottom line is that this is still a market of bulls; bears need to prove their case.
For starters, they should keep the index below our 1107 pivot
They should also force a gap fill around 1070 and a test of our 1061 pivot. They should then force a series of lower lows and lower highs on the daily frame.
Anything else is consolidation, which may result in another assault by the bulls at higher highs.
Support is 1061. Resistance is 1090 and 1107.
Short term trend is down. Mid-term trend is up. Long term trend is down.
Have a Nice Weekend!
Have a Nice Weekend!
By Piazzi
http://markettime.blogspot.com/
http://markettime.wordpress.com/
I am a self taught market participant with more than 12 years of managing my own money. My main approach is to study macro level conditions affecting the markets, and then use technical analysis to either find opportunities or stay out of trouble. Staying out of trouble (a.k.a Loss) is more important to me than making profits. In addition to my self studies of the markets, I have studied Objective Elliott Wave (OEW) under tutorship of Tony Caldaro.
© 2009 Copyright Piazzi - All Rights Reserved Disclaimer: The above is a matter of opinion provided for general information purposes only and is not intended as investment advice. Information and analysis above are derived from sources and utilising methods believed to be reliable, but we cannot accept responsibility for any losses you may incur as a result of this analysis. Individuals should consult with their personal financial advisors.
© 2005-2022 http://www.MarketOracle.co.uk - The Market Oracle is a FREE Daily Financial Markets Analysis & Forecasting online publication.


