Correction in Progress for Ford
Companies / Company Chart Analysis Nov 19, 2009 - 01:23 AM GMTBy: Mike_Paulenoff
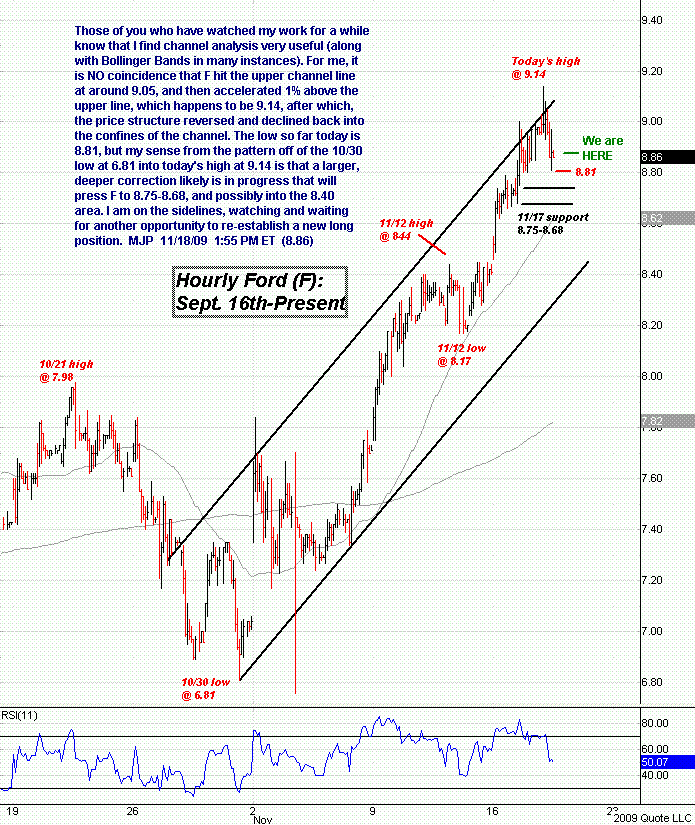
Those who have watched my work for a while know that I find channel analysis very useful (along with Bollinger Bands in many instances). For me, it is no coincidence that Ford (NYSE: F) hit the upper channel line at around 9.05 and then accelerated 1% above the upper line, which happens to be 9.14, after which the price structure reversed and declined back into the confines of the channel.
The low so far today is 8.81, but my sense from the pattern off of the October 30 low at 6.81 into today’s high at 9.14 is that a larger, deeper correction likely is in progress that will press F to 8.75-8.68 and possibly into the 8.40 area. I am on the sidelines, watching and waiting for another opportunity to re-establish a new long position.

Sign up for a free 15-day trial to Mike's ETF Trading Diary today.
By Mike Paulenoff
Mike Paulenoff is author of the MPTrader.com (www.mptrader.com) , a real-time diary of Mike Paulenoff's trading ideas and technical chart analysis of
Exchange Traded Funds (ETFs) that track equity indices, metals, energy commodities, currencies, Treasuries, and other markets. It is for traders with a 3-30 day time horizon, who use the service for guidance on both specific trades as well as general market direction
© 2002-2009 MPTrader.com, an AdviceTrade publication. All rights reserved. Any publication, distribution, retransmission or reproduction of information or data contained on this Web site without written consent from MPTrader is prohibited. See our disclaimer.
Mike Paulenoff Archive |
© 2005-2022 http://www.MarketOracle.co.uk - The Market Oracle is a FREE Daily Financial Markets Analysis & Forecasting online publication.


