


Market Trends for Gold, Crude Oil, and the U.S. Dollar
Commodities / Financial Markets 2009 Nov 16, 2009 - 11:58 AM GMTBy: John_Winston

 In this world we are faced with an ever changing landscape. Nowhere is it truer as soon as you learn the game, the rules are changed. For instance, we are told that gold is signaling an inflationary future coming for the USA, yet its long term interest rates are below the 4% level and short term rates are basically zero. How can this be? Who would lend money to a nation whose currency depreciates and pays almost no return on its debt?
Nations who depend on consumption from the USA have little choice but to extend credit or face economic contraction in their own economies. And while debt has reached 12% of GDP the foreign support of the dollar and treasuries continues for the United States. But there are changes going on. Most disconcerting is the fact that China has been rolling over its debt from the long term bond to the short term Treasuries, which basically pay zero. While there has been little fanfare over this development, one has to wonder why China would forgo a 2 – 3% rate of return in favor of a zero rate of return on investment. This much we know. They have moved their seat in the theater very close to the exit door.
When your biggest creditor moves his seat that close to the exit and the movie is not even close to intermission, one gets the impression that the film is not pleasing to them. Now it would be one thing if China were a paying customer viewing the film. But they are not here to pay and watch the film. They are here to lend money to the filmmaker to use the money to distribute the film to the consuming audience. Let us hope they stay for the remainder of the story.
There can only be one reason interest rates are so low at a time when the monetary base is so expansive and that is that the central bank policy is to avoid a depression and attempt to jump start the economy. While the lowering of interest rates was a success during the Reagan era, it came at a time when interest rates had just completed a cycle high and inflation had completed its run up from the consequences of the US Dollar coming off the gold standard.
The most recent bank bailouts can best be described at this. Cash was distributed to the banking sector to shore up their balance sheets. Instead of taking this money and lending it to industry, it took that cash and deposited back with the Feds by buying up the Treasury curve. And to understand how the stock market can rise at a time like this is simply the consequence of funds and government insured deposits along with Fed liquidity that is channeled from the banks to the hedge funds where the money is put to work in a speculative manner. This “free” money is creating bubbles in Hong Kong real estate and other Far East markets too.
We’ve arrived at a time when the price of many commodities and other financial instruments trade in direct opposite to the US dollar. This brings us to the realization that many markets are invested in as a short position against the US dollar. What else would explain such phenomena?
In 2009, it did not matter where you invested, as long as you stayed away from the US dollar, you’ve done well.
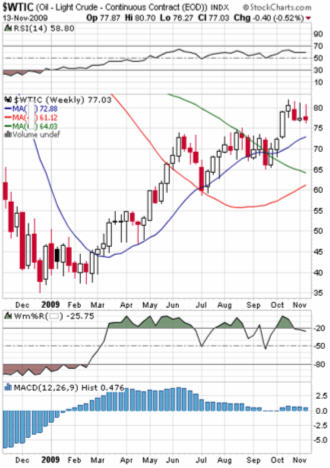
In Crude Oil, we can see that 2009 has produced a doubling of price. Many analysts are now setting their eyes on the 100 dollar level. However, the most recent breakout in price has not followed thru and instead we have gone thru four weeks of sideways price.
Commodity Trends
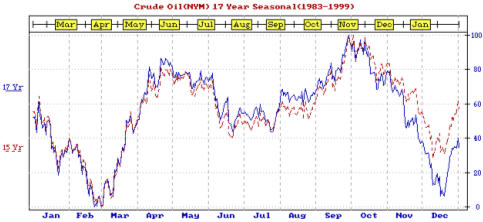
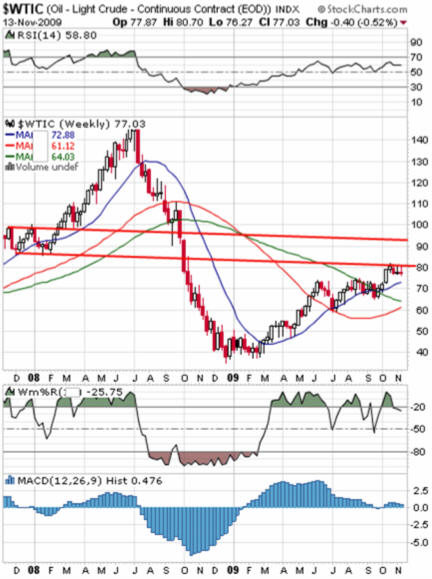
A quick glance at the seasonal chart above shows us why. Crude Oil has just arrived at its weakest seasonal time of the year. The October thru February period on average usually brings lower prices. If we zoom out and look at the chart on a longer term basis, we can see that there is an important band of resistance that exists from the 80-95 dollar area of crude.
Trading Commodities
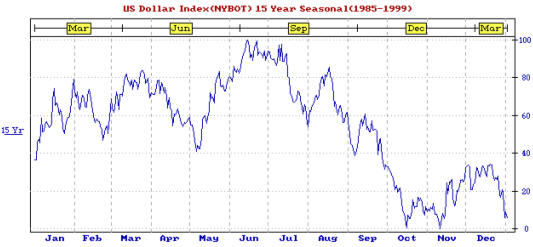
When we combine this factor along with technical indicators that are flashing a potential loss of momentum, we can see that the odds of a strong rising crude price over the next few months would warrant caution here. A lot will depend on the strength of the US Dollar, the supply side equation or a geopolitical event to provide impetus for higher price. However, a move above the highs established in October might provide a burst to the 95 dollar area. But beyond that, while we recognize that price always rules, it would seem the seasonal favor sideways to lower prices on average. This is further confirmed when we look at the seasonal aspects of the US Dollar (chart below). The chart is telling in the fact that it shows the US dollar for the most part, spends most of its time sideways to lower. However, the mid November to mid December time frame is one of these exceptions where the US dollar usually bounces higher. Thus over the next month or so, on average, the crude oil market is most likely to trade sideways to lower and the US dollar should incur a bounce.
Trading Commodity Trends
Bottom line: Crude oil support is the 60-65 area and the 70-72 area based on the moving averages. As long as crude remains above the 72 dollar area, the trend remains up. Should crude oil move above the 83-84 dollar area, then a contra-seasonal rally to the 95 dollar range would be the most likely outcome. Barring a geopolitical event, the crude oil market usually moves lower during this time of year. As long as crude is below the 83-84 area, odds favor lower prices over the next month and potentially into February. Going forward is another story. The lack of planning for an oil emergency in this country could have crippling effects. Can you imagine a crunch during the farming planting season? Since most everything is tied to crude oil prices, it should be on your radar constantly. If peak oil is a truism, there are much higher prices coming in the future for most commodities.
The market that has stolen the spotlight lately is the gold market. While a 20 year bear market went a long way to destroy gold’s image, the first decade of the 21st century has belonged to gold. From its lows of 250 dollars, gold has now climbed almost 900 dollars higher and sits at a historic price peak relative to the US dollar.
Gold is another market that usually sells off in the October and sometimes November time period. True to its cyclicality, gold peaked on October 13th and pulled back into month’s end. However, as soon as November arrived, gold did what it has been doing since September, and that’s rally. As soon as the pullbacks begin in gold, contra-seasonal news hits the street and propels gold higher. In September it was the Chinese telling its citizens to buy gold and silver. In October it was India buying gold and we think this most recent rise might be due to the developing story that tungsten is being discovered in gold bars. While some people last week pointed to the fact that this story is not a new one we want to point out that it sometimes takes a bit of time for investors to grasp the big price changing stories. It’s almost like when you hurt yourself really bad. There’s a time delay before the shock or pain really sets in. We suspect that the gold market may be waking up to the fact that all is not right. We are not certain, but it must make some very uneasy.
Whether this is true or not we cannot dismiss the fact that many countries are in the process of calling their gold out of storage and demanding they be returned back to the mother countries. To me, these are signs of uncertainty and fear and not just prudence. Time will tell.
Gold Trends
Now if all is well in the gold community, why would countries call their gold out of storage facilities? Can you think of any other reason besides CONCERN? Why would you take your money out of your local bank to store it home? Think for a moment the potential for panic as 400 ounce gold bars get drilled and tungsten is found in the middle. Now this is all speculation on my part, but it is something that bears (no pun intended) watching over the coming weeks.
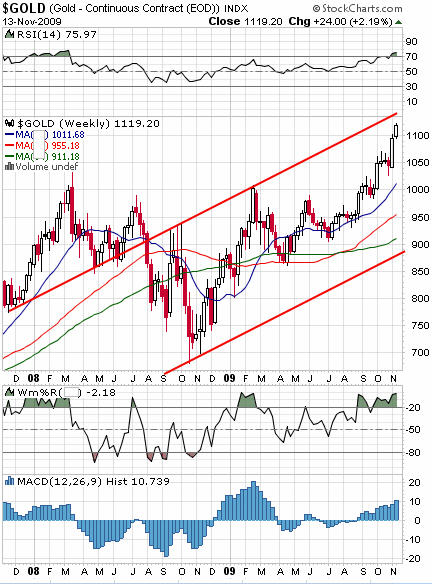
The one thing that we are not speculating on is the price chart. We can see that there is no doubt that gold has broken out to the upside in very strong fashion. So strong is gold that the overbought readings are their highest since 1981. Over the past few weeks we continue to make new highs at a time when gold should be correcting. Now we are approaching an important price point on the weekly chart which should give us clue as to whether gold will finally produce a pullback. Notice that the weekly chart channel that has been drawn shows a potential price resistance area directly ahead of us. The 1135-1150 area is an area where gold should at least see some type of pullback. We say should because gold has traded above this channel line once before during the peaks of 2008. However, it was also a key resistance in the November timeframe of 2008 and the 2009 February price peak. That we have arrived back at this resistance line a full year later is interesting and from a cyclical standpoint, is suggesting that it could be an important price and time area.
Gold Trend
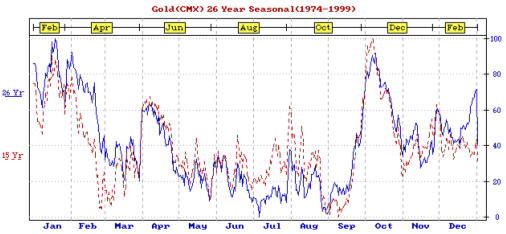
We can see by the gold seasonal chart that November usually has a quick and sharp mid month pullback and a higher price into month’s end. More important is the overall trend for November and December and that is sideways. The 2007 bull market in gold saw a November and December sideways price pattern during its bull run, might we see the same thing this year?
The point we are trying to make is barring a panic up move, the odds that a pullback in gold is due is high. Yet, when a major move is underway in a market, this is always the circumstance. The market just keeps going higher until (or so it seems) those who have been waiting to jump on capitulate and jump on. You probably already know the rest of the story. The market peaks a few days or a week later and a good correction sets in. So what is an investor to do?
In order to avoid making decisions like this, an investor needs to make a decision before these moves have covered so much ground. While it is never easy buying at high prices there are times when price must be perceived differently. Gold is only $300 dollars higher than its 1980 peak. Does that make gold feel cheaper? Even if it doesn’t there is one thing you need to consider.
For gold to have exceeded its 1980 price is a very bullish development for the simple reason that it tells us that demand has returned to this market. This year’s pullback low was the same price area as the 1980 high. Since then, it has rallied almost 300 dollars.
During the last 19 months, gold established a new ceiling, the triple digit 1000 United States dollar area where it would always run into resistance. While gold was a victim of the meltdown of 2008, a closer look at the chart shows that it was a courtesy drop and with the exception of a monthly close of 728 at the height of the crash, gold was the first commodity to bottom, a full 5 months before the stock market, and is the only commodity to establish a post crash high. The fact that China, India, and central banks are buying gold certainly must send chills down the spine of the ponzi scheme dollar printers and the massive short positions in gold. The fundamentals……….and accompanying price charts all seem bullish for gold.
If this is a super bull market it is really just beginning to accelerate.
We are at a point in the gold cycle where entering here can be risky due to the overbought condition of the market and its potential to pullback is a consideration. This is why it is important to first recognize important long term price points like 1000 in gold and to have an entry and exit plan to participate in a market that is moving. The difficulty with not acting when one should is that the average investor wants to buy when prices are low or worse, waits for the pullback that never comes. In a REAL BULL, the pullback doesn’t come. So there are times when major price points are exceeded that entering the market is prudent. The breakout above the highs of March 2007 and subsequent rise higher is developing on a weekly chart and is therefore much more powerful that a daily breakout. Consequently the price ranges expand and the moves also become more pronounced and investors have to make decisions WHEN these breakouts occur, not 100 bucks higher.
Gold has given us clues to its strength by making the 2009 low equal to the 1980 high, and then successfully hurdled 1000 and held. Its first pullback since the rally above 1000 dropped to just under its March 2007 high and since then, the STRONGEST part of the rally has developed.
From a cyclical standpoint and from a price resistance area, this coming week and the 1135-1180 area in gold stand a good chance of providing a peak and 2-6 week pullback. This is the most likely scenario, however, when markets reach this level of momentum, the market can at times ignore all technical factors and just continue higher. For instance, gold demonstrated a few weeks ago that it was not afraid to rally even when the US Dollar was moving higher. These are very bullish developments.
All of these indications seem to suggest that gold is in a major bull market albeit in need of a pullback to take some of the froth out. As far as a “b” wave potential, I am not an Ellot Wave expert, but know enough to be dangerous. My take is this. If gold doesn’t peak here, and moves above 1200, I just can’t see how one could justify this as a bear market wave. Still there are some worrisome factors. Silver, Platinum and gold stocks are well below their highs and GOLD IS ALONE as the one moving higher. This is usually a bearish development in the metals and the only exception would be that gold is in a super bull move.
From an investor standpoint, the key is having a battle plan for your entry and exit tactics. The crude oil and gold markets can provide a nice way to hedge against dollar depreciation, but we must always remember that the geopolitical and demand supply economics must be included in the mix.
Gold’s wild card is it is the currency of last resort. If a global currency meltdown or panic occurs, gold will be the safe haven. On the other side of the equation, is what the ramifications are for gold should the world experience a credit contraction. (Depression). Should one be long GOLD or RICE?
In closing, we think the oil and gold market while still in up trends, are susceptible to seasonal influence here. Gold is currently the market of choice, but should OIL MOVE above that red resistance line, a quick rally to the 95 dollar area could develop fast. As long as oil is below the 84 dollar a barrel area, we think the seasonal favors a pullback. In gold, investors should be looking for a pullback to which they can jump onto in this strong market. We think the upside is limited to the 1135-1185 area over the coming weeks and that a healthy pullback would be good for the gold market.
Whatever direction gold and oil take one needs to be following the overall trends and looking to identify the price areas and times where nice set ups occur so as to enter with the least possible amount of risk to the trade. If that sounds interesting to you, we invite you to stop by our website, kick the tires, and see what tactics we are looking at in the oil and metal markets and suggesting to our readers.
If you would like to receive Free Gold Analysis please visit my site: www.TechnicalCommodityTrader.com
By John Winston
John Winston is the technical commodity trader analyst. He provides detailed technical analysis for popular commodities like gold, silver, copper, oil, and natural gas. By focusing strictly on these commodity price movements trading become strictly technical and simple to trade. His free trading reports are available at his website: www.TechnicalCommodityTrader.com
Contact John at: Info [@] TechnicalCommodityTrader.com
© Copyright John Winston 2009
Disclaimer: The above is a matter of opinion provided for general information purposes only and is not intended as investment advice. Information and analysis above are derived from sources and utilising methods believed to be reliable, but we cannot accept responsibility for any losses you may incur as a result of this analysis. Individuals should consult with their personal financial advisors.
© 2005-2022 http://www.MarketOracle.co.uk - The Market Oracle is a FREE Daily Financial Markets Analysis & Forecasting online publication.